
Page 98 - EER-2-3
P. 98
Explora: Environment
and Resource Comparative analysis of THMs and THAAs in water distribution media
Since gas chromatography separates compounds based the corresponding water quality parameters presented in
on their volatility, trichloromethane—a small and volatile Figure S5.
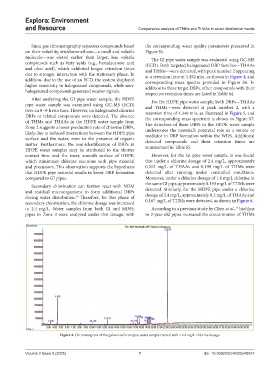
molecule—was eluted earlier than larger, less volatile The GI pipe water sample was evaluated using GC-MS
compounds such as fatty acids (e.g., hexadecenoic acid (ECD). Both targeted halogenated DBP families—THAAs
and oleic acid), which exhibited longer retention times and THMs—were detected, with peak number 2 appearing
due to stronger interaction with the stationary phase. In at a retention time of 4.452 min, as shown in Figure 4, and
addition, due to the use of an ECD, the system displayed corresponding mass spectra provided in Figure S6. In
higher sensitivity to halogenated compounds, while non- addition to these target DBPs, other compounds with their
halogenated compounds generated weaker signals. respective retention times are listed in Table S4.
After analyzing the GI pipe water sample, the HDPE For the HDPE pipe water sample, both DBPs—THAAs
pipe water sample was examined using GC-MS (ECD) and THMs—were detected at peak number 2, with a
over an 8–9-h run time. However, no halogenated chlorine retention time of 4.340 min, as illustrated in Figure 5, and
DBPs or related compounds were detected. The absence the corresponding mass spectrum is shown in Figure S7.
of THMs and THAAs in the HDPE water sample from The detection of these DBPs in the HPDE water sample
Zone 2 suggests a lower production rate of chlorine DBPs, underscores the material’s potential role as a source or
likely due to reduced interactions between the HDPE pipe mediator in DBP formation within the WDS. Additional
surface and the water, even in the presence of organic detected compounds and their retention times are
matter. Furthermore, the non-identification of DBPs in summarized in Table S5.
HDPE water samples may be attributed to the shorter
contact time and the inert, smooth surface of HDPE, However, for the GI pipe water sample, it was found
which minimizes chlorine reactions with pipe material that under a chlorine dosage of 2.4 mg/L, approximately
and precursors. This observation supports the hypothesis 0.212 mg/L of THAAs and 0.199 mg/L of THMs were
that HDPE pipe material results in lower DBP formation detected after running under controlled conditions.
compared to GI pipes. Moreover, under a chlorine dosage of 1.8 mg/L chlorine in
the same GI pipe, approximately 0.193 mg/L of THMs were
Secondary chlorination can further react with NOM
and residual microorganisms to form additional DBPs detected. Similarly, for the HDPE pipe under a chlorine
during water distribution. Therefore, for this phase of dosage of 2.4 mg/L, approximately 0.2 mg/L of THAAs and
10
secondary chlorination, the chlorine dosage was increased 0.167 mg/L of THMs were detected, as shown in Figure 6.
to 2.4 mg/L. Water samples from both GI and HDPE According to a previous study by Chen et al., biofilms
15
pipes in Zone 3 were analyzed under this dosage, with in 2-year-old pipes increased the concentration of THMs
Figure 4. Chromatogram of the galvanized iron pipe water sample treated with a 2.4 mg/L chlorine dosage
Volume 2 Issue 3 (2025) 7 doi: 10.36922/EER025240047