Page 63 - EER-2-3
P. 63

Explora: Environment
            and Resource                                                     Electrocatalyst for ammonia oxidation reaction


                        A                                   B


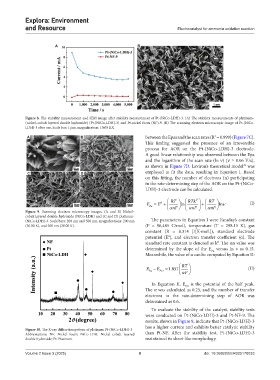
            Figure 8. The stability measurement and SEM image after stability measurement of Pt-(NiCo-LDH)-3. (A) The stability measurements of platinum–
            (nickel–cobalt layered double hydroxide) (Pt-[NiCo-LDH]-3) and Pt-nickel foam (NF)-9. (B) The scanning electron microscopic image of Pt-(NiCo-
            LDH)-3 after use. Scale bar: 1 μm, magnification: 10.00 KX.

             A                     B                           between the Epas and the scan rates (R  = 0.999) (Figure 7C).
                                                                                            2
                                                               This finding suggested the presence of an irreversible
                                                               process for AOR on the Pt-(NiCo-LDH)-3 electrode.
                                                               A good linear relationship was observed between the Epa
                                                               and the logarithm of the scan rate (ln ν) (ν ≥ 0.06 V/s),
                                                               as shown in Figure 7D. Laviron’s theoretical model  was
                                                                                                         29
             C                     D                           employed to fit the data, resulting in Equation I. Based
                                                               on this fitting, the number of electrons (n) participating
                                                               in the rate-determining step of the AOR on the Pt-(NiCo-
                                                               LDH)-3 electrode can be calculated.

                                                                               RT  θ   RTk     RT
                                                               E Pa  =  E θ +      ln     +      ln ν  (I)
            Figure  9. Scanning electron microscopy images. (A and B) Nickel–    α      αnF     αnF   nF
            cobalt layered double hydroxide (NiCo-LDH) and (C and D) platinum-
            (NiCo-LDH)-3. Scale bars: 200 nm and 500 nm, magnifications: 200 nm   The parameters in Equation I were Faraday’s constant
            (50.00 K), and 500 nm (20.00 K).                   (F = 96,485  C/mol), temperature (T = 298.15 K), gas
                                                               constant (R = 8.314 J/[K·moL]), standard electrode
                                                               potential (E ), and electron transfer coefficient  (α). The
                                                                         θ
                                                               standard rate constant is denoted as k . The αn value was
                                                                                              θ
                                                               determined by the slope of the  E  versus ln  ν as 0.15.
                                                                                           Pa
                                                               Meanwhile, the value of α can be computed by Equation II:
                                                                                 RT
                                                                  − E  = E  1.857                          (II)
                                                                Pa   P /2       
                                                                               α  F
                                                                 In Equation II, E  is the potential of the half peak.
                                                                                P∕2
                                                               The α was calculated as 0.25, and the number of transfer
                                                               electrons in the rate-determining step of AOR was
                                                               determined as 0.6.
                                                                 To evaluate the stability of the catalyst, stability tests
                                                               were conducted on Pt-(NiCo-LDH)-3 and Pt-NF-9. The
                                                               results, shown in Figure 8, indicate that Pt-(NiCo-LDH)-3
                                                               has a higher current and exhibits better catalytic stability
            Figure 10. The X-ray diffraction pattern of platinum Pt-(NiCo-LDH)-3
            Abbreviations: NF: Nickel foam; NiCo-LDH: Nickel–cobalt layered   than  Pt-NF. After  the  stability  test,  Pt-(NiCo-LDH)-3
            double hydroxide; Pt: Platinum.                    maintained its sheet-like morphology.


            Volume 2 Issue 3 (2025)                         8                           doi: 10.36922/EER025170033
   58   59   60   61   62   63   64   65   66   67   68