
Page 104 - EJMO-9-1
P. 104
Eurasian Journal of Medicine and
Oncology
Genomics of breast cancer in Western Kazakhstan
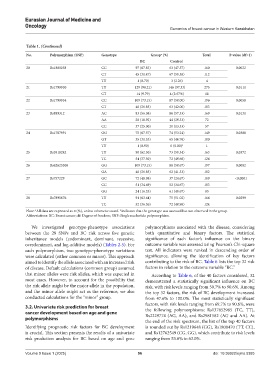
Table 1. (Continued)
No. Polymorphism (SNP) Genotype Group (%) Total P‑value (df=1)
a
BC Control
20 Rs1800058 CC 97 (67.83) 63 (47.37) 160 0.0022
CT 45 (31.47) 67 (50.38) 112
TT 1 (0.70) 3 (2.26) 4
21 Rs1799950 TT 129 (90.21) 146 (97.33) 275 0.0111
CT 14 (9.79) 4 (2.67%) 18
22 Rs1799954 CC 109 (73.15) 87 (58.00) 196 0.0058
CT 40 (26.85) 63 (42.00) 103
23 Rs889312 AC 83 (56.08) 86 (57.33) 169 0.0131
AA 28 (18.92) 44 (29.33) 72
CC 37 (25.00) 20 (13.33) 57
24 Rs1787991 GG 75 (67.57) 74 (53.24) 149 0.0308
GT 35 (31.53) 65 (46.76) 100
TT 1 (0.90) 0 (0.00)* 1
25 Rs3918242 TT 90 (62.50) 73 (50.34) 163 0.0372
TC 54 (37.50) 72 (49.66) 126
26 Rs62625308 GG 109 (73.15) 88 (58.67) 197 0.0082
GA 40 (26.85) 62 (41.33) 102
27 Rs757229 GC 72 (48.98) 37 (24.67) 109 <0.0001
CC 51 (34.69) 52 (34.67) 103
GG 24 (16.33) 61 (40.67) 85
28 Rs7895676 TT 91 (63.64) 75 (51.02) 166 0.0299
TC 52 (36.36) 72 (48.98) 124
a
Note: All data are expressed as n (%), unless otherwise stated. *indicates that the genotype was assessed but not observed in the group.
Abbreviations: BC: Breast cancer; df: Degree of freedom; SNP: Single nucleotide polymorphism.
We investigated genotype-phenotype associations polymorphisms associated with the disease, considering
between the 28 SNPs and BC risk across five genetic both quantitative and binary factors. The statistical
inheritance models (codominant, dominant, recessive, significance of each factor’s influence on the binary
overdominant, and log-additive models) (Tables 2‑5). For outcome variable was assessed using Pearson’s Chi-square
each polymorphism, two genotype-phenotype variations test. All indicators were ranked in descending order of
were calculated (either common or minor). This approach significance, allowing the identification of key factors
aimed to identify the allele associated with an increased risk contributing to the risk of BC. Table 6 lists the top 32 risk
of disease. Default calculations (common group) assumed factors in relation to the outcome variable “BC.”
that minor alleles were risk alleles, which was expected in According to Table 6, of the 40 factors considered, 32
most cases. However, to account for the possibility that demonstrated a statistically significant influence on BC
the risk allele might be the major allele in the population, risk, with risk levels ranging from 50.7% to 90.6%. Among
and the minor allele might act as the reference, we also the top 32 factors, the risk of BC development increased
conducted calculations for the “minor” group. from 47.6% to 100.0%. The most statistically significant
factors, with risk levels ranging from 69.7% to 90.6%, were
3.2. Univariate risk prediction for breast the following polymorphisms: Rs137852985 (TC, TT),
cancer development based on age and gene Rs2229774 (AG, AA), and Rs2981582 (AG and AA). At
polymorphisms the end of the risk spectrum, the list of the top 40 factors
Identifying prognostic risk factors for BC development is rounded out by Rs1219648 (GG), Rs1800470 (TT, CC),
is crucial. This section presents the results of a univariate and Rs12762549 (CG, GG), which contribute to risk levels
risk prediction analysis for BC based on age and gene ranging from 53.0% to 63.0%.
Volume 9 Issue 1 (2025) 96 doi: 10.36922/ejmo.5385