
Page 105 - EJMO-9-1
P. 105
Eurasian Journal of Medicine and
Oncology
Genomics of breast cancer in Western Kazakhstan
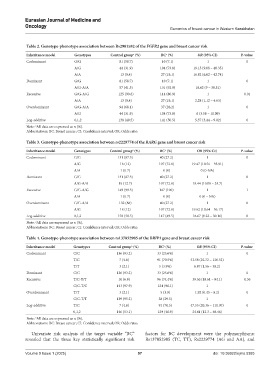
Table 2. Genotype‑phenotype association between Rs2981582 of the FGFR2 gene and breast cancer risk
Inheritance model Genotypes Control group (%) BC (%) OR (95% CI) P‑value
a
a
Codominant G/G 81 (58.7) 10 (7.1) 1 0
A/G 44 (31.9) 104 (73.8) 19.15 (9.08 – 40.35)
A/A 13 (9.4) 27 (19.1) 16.82 (6.62 – 42.74)
Dominant G/G 81 (58.7) 10 (7.1) 1 0
A/G-A/A 57 (41.3) 131 (92.9) 18.62 (9 – 38.51)
Recessive G/G-A/G 125 (90.6) 114 (80.9) 1 0.01
A/A 13 (9.4) 27 (19.1) 2.28 (1.12 – 4.63)
Overdominant G/G-A/A 94 (68.1) 37 (26.2) 1 0
A/G 44 (31.9) 104 (73.8) 6 (3.58 – 10.09)
Log-additive 0,1,2 138 (49.5) 141 (50.5) 5.57 (3.44 – 9.02) 0
a
Note: All data are expressed as n (%).
Abbreviations: BC: Breast cancer; CI: Confidence interval; OR: Odds ratio.
Table 3. Genotype‑phenotype association between rs2229774 of the RARG gene and breast cancer risk
Inheritance model Genotypes Control group (%) BC (%) OR (95% CI) P‑value
a
a
Codominant G/G 131 (87.3) 40 (27.2) 1 0
A/G 18 (12) 107 (72.8) 19.47 (10.56 – 35.91)
A/A 1 (0.7) 0 (0) 0 (0-NA)
Dominant G/G 131 (87.3) 40 (27.2) 1 0
A/G-A/A 19 (12.7) 107 (72.8) 18.44 (10.09 – 33.7)
Recessive G/G-A/G 149 (99.3) 147 (100) 1 1
A/A 1 (0.7) 0 (0) 0 (0 – NA)
Overdominant G/G-A/A 132 (88) 40 (27.2) 1 0
A/G 18 (12) 107 (72.8) 19.62 (10.64 – 36.17)
Log-additive 0,1,2 150 (50.5) 147 (49.5) 16.67 (9.22 – 30.16) 0
a
Note: All data are expressed as n (%).
Abbreviations: BC: Breast cancer; CI: Confidence interval; OR: Odds ratio.
Table 4. Genotype‑phenotype association between rs137852985 of the BRIP1 gene and breast cancer risk
Inheritance model Genotypes Control group (%) BC (%) OR (95% CI) P‑value
a
a
Codominant C/C 136 (93.2) 33 (25.6%) 1 0
T/C 7 (4.8) 91 (70.5%) 53.58 (22.72 – 126.32)
T/T 3 (2.1) 5 (3.9%) 6.87 (1.56 – 30.2)
Dominant C/C 136 (93.2) 33 (25.6%) 1 0
Recessive T/C-T/T 10 (6.8) 96 (74.4%) 39.56 (18.61 – 84.1) 0.36
C/C-T/C 143 (97.9) 124 (96.1) 1
Overdominant T/T 3 (2.1) 5 (3.9) 1.92 (0.45 – 8.2) 0
C/C-T/T 139 (95.2) 38 (29.5) 1
Log-additive T/C 7 (4.8) 91 (70.5) 47.55 (20.36 – 111.07) 0
0,1,2 146 (53.1) 129 (46.9) 24.41 (12.3 – 48.46)
Note: All data are expressed as n (%).
a
Abbreviations: BC: Breast cancer; CI: Confidence interval; OR: Odds ratio.
Univariate risk analysis of the target variable “BC” factors for BC development were the polymorphisms:
revealed that the three key statistically significant risk Rs137852985 (TC, TT), Rs2229774 (AG and AA), and
Volume 9 Issue 1 (2025) 97 doi: 10.36922/ejmo.5385