
Page 108 - EJMO-9-1
P. 108
Eurasian Journal of Medicine and
Oncology
Genomics of breast cancer in Western Kazakhstan
Table 7. Patient risk classes for the target indicator “breast cancer,” sorted by descending risk
No. Class definition Group size Class proportion, % Risk, %
1 Rs137852985 (TC, TT) & Rs2981582 (AA, GG) 20 7.3 100.0
2 Rs137852985 (TC, TT) & Rs2981582 (AG) 86 31.3 88.4
3 Rs137852985 (CC) & Rs757229 (GC) & age ≥56.0 years 30 10.9 50.0
4 Rs137852985 (CC) & Rs757229 (GC) & age years <56.0 30 10.9 30.0
5 Rs137852985 (CC) & Rs757229 (CC, GG) & age 49.0 years 62 22.5 14.5
6 Rs137852985 (CC) & Rs757229 (CC, GG) & age <49.0 years 47 17.1 0.0
Table 8. Predictive quality indicators of the constructed
decision tree for the target outcome “breast cancer” based on
risk polymorphisms identified in the current study
Metric Value
Cutoff point 50.0%
AuROC 0.95
Sensitivity 86.0%
Specificity 92.4%
Effectiveness 89.2%
Abbreviation: AuROC: Area under the receiver operating characteristic
curve.
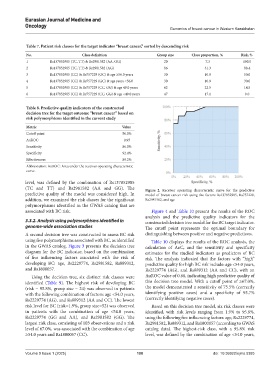
level, was defined by the combination of Rs137852985
(TC and TT) and Rs2981582 (AA and GG). The Figure 2. Receiver operating characteristic curve for the predictive
predictive quality of the model was considered high. In model of breast cancer risk using the factors Rs137852985, Rs757229,
addition, we examined the risk classes for the significant Rs2981582, and age
polymorphisms identified in the GWAS catalog that are
associated with BC risk. Figure 4 and Table 10 present the results of the ROC
analysis and the predictive quality indicators for the
3.3.2. Analysis using polymorphisms identified in constructed decision tree model for the BC target indicator.
genome-wide association studies The cutoff point represents the optimal boundary for
A second decision tree was constructed to assess BC risk distinguishing between positive and negative predictions.
using five polymorphisms associated with BC, as identified Table 10 displays the results of the ROC analysis, the
in the GWAS catalog. Figure 3 presents the decision tree calculation of AuC, and the sensitivity and specificity
diagram for the BC indicator, based on the combination estimates for the studied indicators as predictors of BC
of five influencing factors associated with the risk of risk. The analysis indicated that the factors with “high”
developing BC: age, Rs2229774, Rs2981582, Rs889312, predictive quality for high BC risk include: age <54.0 years,
and Rs1800057. Rs2229774 (AG), and Rs889312 (AA and CC), with an
Using the decision tree, six distinct risk classes were AuROC value of 0.88, indicating high predictive quality of
identified (Table 9). The highest risk of developing BC this decision tree model. With a cutoff point of ≥67.0%,
(risk = 95.8%, group size = 24) was observed in patients the model demonstrated a sensitivity of 75.5% (correctly
with the following combination of factors: age <54.0 years, identifying positive cases) and a specificity of 93.7%
Rs2229774 (AG), and Rs889312 (AA and CC). The lowest (correctly identifying negative cases).
risk level for BC (risk=1.9%, group size=52) was observed Based on this decision tree model, six risk classes were
in patients with the combination of age <54.0 years, identified, with risk levels ranging from 1.9% to 95.8%,
Rs2229774 (GG and AA), and Rs2981582 (GG). The using the following five influencing factors: age, Rs2229774,
largest risk class, consisting of 103 observations and a risk Rs2981582, Rs889312, and Rs1800057 (according to GWAS
level of 67.0%, was associated with the combination of age catalog data). The highest-risk class, with a 95.8% risk
≥54.0 years and Rs1800057 (CC). level, was defined by the combination of age <54.0 years,
Volume 9 Issue 1 (2025) 100 doi: 10.36922/ejmo.5385