
Page 106 - EJMO-9-1
P. 106
Eurasian Journal of Medicine and
Oncology
Genomics of breast cancer in Western Kazakhstan
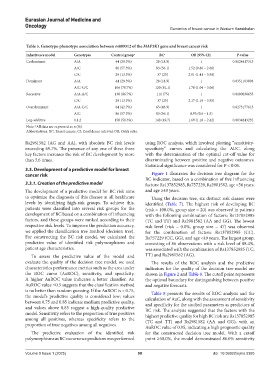
Table 5. Genotype‑phenotype association between rs889312 of the MAP3K1 gene and breast cancer risk
Inheritance model Genotypes Control group a BC a OR (95% CI) P‑value
Codominant A/A 44 (29.3%) 28 (18.9) 1 0.0124417313
A/C 86 (57.3%) 83 (56.1) 1.52 (0.86 – 2.66)
C/C 20 (13.3%) 37 (25) 2.91 (1.41 – 5.98)
Dominant A/A 44 (29.3%) 28 (18.9) 1 0.0351103098
A/C-C/C 106 (70.7%) 120 (81.1) 1.78 (1.04 – 3.06)
Recessive A/A-A/C 130 (86.7%) 111 (75) 1 0.0100038635
C/C 20 (13.3%) 37 (25) 2.17 (1.19 – 3.95)
Overdominant A/A-C/C 64 (42.7%) 65 (43.9) 1 0.8273177615
A/C 86 (57.3%) 83 (56.1) 0.95 (0.6 – 1.5)
Log-additive 0,1,2 150 (50.3%) 148 (49.7) 1.69 (1.18 – 2.42) 0.0034843232
Note: All data are expressed as n (%).
a
Abbreviations: BC: Breast cancer; CI: Confidence interval; OR: Odds ratio.
Rs2981582 (AG and AA), with absolute BC risk levels using ROC analysis, which involved plotting “sensitivity-
exceeding 69.7%. The presence of any one of these three specificity” curves and calculating the AUC, along
key factors increases the risk of BC development by more with the determination of the optimal cut-off value for
than 3.6 times. discriminating between positive and negative outcomes.
Statistical significance was considered for P < 0.05.
3.3. Development of a predictive model for breast
cancer risk Figure 1 illustrates the decision tree diagram for the
BC indicator, based on a combination of five influencing
3.3.1. Creation of the predictive model factors: Rs137852985, Rs757229, Rs2981582, age <56 years,
The development of a predictive model for BC risk aims and age ≥49 years.
to optimize the diagnosis of this disease at all healthcare Using the decision tree, six distinct risk classes were
levels by identifying high-risk groups. To achieve this, identified (Table 7). The highest risk of developing BC
patients were classified into several risk groups for the (risk = 100.0%, group size = 20) was observed in patients
development of BC based on a combination of influencing with the following combination of factors: Rs137852985
factors, and these groups were ranked according to their (TC and TT) and Rs2981582 (AA and GG). The lowest
respective risk levels. To improve the prediction accuracy, risk level (risk = 0.0%, group size = 47) was observed
we applied the classification tree method (decision tree). for the combination of factors: Rs137852985 (CC),
For constructing the BC risk model, we calculated the Rs757229 (CC, GG), and age <49 years. The largest group,
predictive value of identified risk polymorphisms and consisting of 86 observations with a risk level of 88.4%,
patient age characteristics. was associated with the combination of Rs137852985 (TC,
To assess the predictive value of the model and TT) and Rs2981582 (AG).
evaluate the quality of the decision tree model, we used The results of the ROC analysis and the predictive
characteristics performance metrics such as the area under indicators for the quality of the decision tree model are
the ROC curve (AuROC), sensitivity, and specificity. shown in Figure 2 and Table 8. The cutoff point represents
A higher AuROC value indicates a better classifier. An the optimal boundary for distinguishing between positive
AuROC value ≤0.5 suggests that the classification method and negative forecasts.
is no better than random guessing. If the AuROC is < 0.75, Table 8 presents the results of ROC analysis and the
the model’s predictive quality is considered low; values calculation of AuC, along with the assessment of sensitivity
between 0.75 and 0.85 indicate medium predictive quality, and specificity for the studied parameters as predictors of
and values above 0.85 suggest a high-quality predictive BC risk. The analysis suggested that the factors with the
model. Sensitivity refers to the proportion of true positives highest predictive quality for high BC risk are Rs137852985
among all positives, whereas specificity refers to the (TC and TT) and Rs2981582 (AA and GG), with an
proportion of true negatives among all negatives. AuROC value of 0.95, indicating a high prognostic quality
The predictive evaluation of the identified risk for the constructed decision tree model. With a cutoff
polymorphisms as BC occurrence predictors was performed point ≥50.0%, the model demonstrated 86.0% sensitivity
Volume 9 Issue 1 (2025) 98 doi: 10.36922/ejmo.5385