
Page 107 - EJMO-9-1
P. 107
Eurasian Journal of Medicine and
Oncology
Genomics of breast cancer in Western Kazakhstan
Table 6. Top 32 key factors influencing the “breast cancer” indicator outcome (absolute risk estimates, risk change, and
relative risk)
Factor BC: Frequency (%) Risk change (95% CI) b Relative risk (95% CI) P‑value
a
Factor: Absent Factor: Present
Rs137852985 (TC and TT) 33 (19.5) 96 (90.6) 71.0 (62.9 – 79.2) 4.64 (3.39 – 6,34) <0.0001
Rs2229774 (AG and AA) 40 (23.4) 107 (84.9) 61.5 (52.6 – 70.4) 3.63 (2.74 – 4,81) <0.0001
Rs2981582 (AG and AA) 10 (11.0) 131 (69.7) 58.7 (49.5 – 67.9) 6.34 (3.51 – 11.47) <0.0001
Rs757229 (GC and CC) 24 (28.2) 123 (58.0) 29.8 (18.1 – 41.4) 2.05 (1.44 – 2.94) <0.0001
Age, years ≥54,0 52 (36.9) 96 (61.1) 24.3 (13.2 – 35.3) 1.66 (1.29 – 2.13) <0.0001
Rs1800058 (CC) 46 (39.7) 97 (60.6) 21.0 (9.3 – 32.7) 1.53 (1.18 – 1.98) 0.0006
Rs137852576 (AG) 34 (35.4) 107 (55.2) 19.7 (7.9 – 31.6) 1.56 (1.16 – 2.10) 0.0016
Rs4987117 (CC) 40 (38.5) 109 (55.9) 17.4 (5.8 – 29.1) 1.45 (1.11 – 1.91) 0.0041
Rs1799954 (CC) 40 (38.8) 109 (55.6) 16.8 (5.1 – 28.5) 1.43 (1.09 – 1.88) 0.0058
Rs80357382 (TT) 38 (38.0) 105 (54.4) 16.4 (4.6 – 28.2) 1.43 (1.08 – 1.90) 0.0077
Rs3918290 (CC) 40 (39.2) 109 (55.3) 16.1 (4.4 – 27.9) 1.41 (1.07 – 1.85) 0.0082
Rs11203289 (GG) 40 (39.2) 109 (55.3) 16.1 (4.4 – 27.9) 1.41 (1.07 – 1.85) 0.0082
Rs11571747 (AA) 40 (39.2) 109 (55.3) 16.1 (4.4 – 27.9) 1.41 (1.07 – 1.85) 0.0082
Rs80359062 (CC) 40 (39.2) 109 (55.3) 16.1 (4.4 – 27.9) 1.41 (1.07 – 1.85) 0.0082
Rs62625308 (GG) 40 (39.2) 109 (55.3) 16.1 (4.4 – 27.9) 1.41 (1.07 – 1.85) 0.0082
Rs34945627 (CC) 39 (39.0) 107 (55.2) 16.2 (4.3 – 28.0) 1.41 (1.07 – 1.86) 0.0087
Rs3092856 (CC) 40 (39.2) 107 (55.2) 15.9 (4.2 – 27.7) 1.41 (1.07 – 1.85) 0.0091
Rs55886062 (AA) 40 (39.2) 108 (55.1) 15.9 (4.1 – 27.6) 1.41 (1.07 – 1.85) 0.0093
Rs28934577 (AA) 40 (39.2) 108 (55.1) 15.9 (4.1 – 27.6) 1.41 (1.07 – 1.85) 0.0093
Rs1800057 (CC) 40 (39.2) 108 (55.1) 15.9 (4.1 – 27.6) 1.41 (1.07 – 1.85) 0.0093
Note: All data are expressed as sample size (%); All data are expressed in %.
a
b
Abbreviations: BC: Breast cancer; CI: Confidence interval.
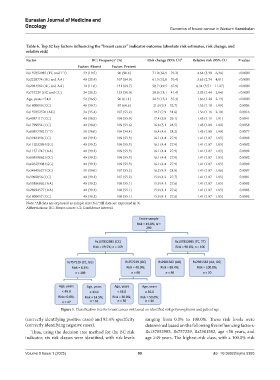
Figure 1. Classification tree for breast cancer risk based on identified risk polymorphisms and patient age
(correctly identifying positive cases) and 92.4% specificity ranging from 0.0% to 100.0%. These risk levels were
(correctly identifying negative cases). determined based on the following five influencing factors:
Thus, using the decision tree method for the BC risk Rs137852985, Rs757229, Rs2981582, age <56 years, and
indicator, six risk classes were identified, with risk levels age ≥49 years. The highest-risk class, with a 100.0% risk
Volume 9 Issue 1 (2025) 99 doi: 10.36922/ejmo.5385