
Page 281 - EJMO-9-2
P. 281
Eurasian Journal of
Medicine and Oncology QGJSF multi-target mechanisms in osteoporosis
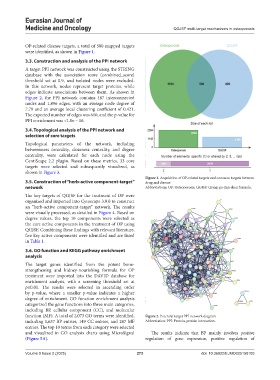
OP-related disease targets, a total of 500 mapped targets
were identified, as shown in Figure 1.
3.3. Construction and analysis of the PPI network
A target PPI network was constructed using the STRING
database with the association score (combined_score)
threshold set at 0.9, and isolated nodes were excluded.
In this network, nodes represent target proteins, while
edges indicate associations between them. As shown in
Figure 2, the PPI network contains 487 interconnected
nodes and 1,896 edges, with an average node degree of
7.79 and an average local clustering coefficient of 0.421.
The expected number of edges was 610, and the p-value for
PPI enrichment was <1.0e – 16.
3.4. Topological analysis of the PPI network and
selection of core targets
Topological parameters of the network, including
betweenness centrality, closeness centrality, and degree
centrality, were calculated for each node using the
CentiScape 2.2 plugin. Based on these metrics, 33 core
targets were selected and subsequently visualized, as
shown in Figure 3.
Figure 1. Acquisition of OP-related targets and common targets between
3.5. Construction of “herb-active component-target” drug and disease
network Abbreviations: OP: Osteoporosis; QGJSF: Qiang-gu-jian-shen formula.
The key targets of QGJSF for the treatment of OP were
organized and imported into Cytoscape 3.9.0 to construct
an “herb-active component-target” network. The results
were visually processed, as detailed in Figure 4. Based on
degree values, the top 10 components were selected as
the core active components in the treatment of OP using
QGJSF. Combining these findings with relevant literature,
five key active components were identified and are listed
in Table 1.
3.6. GO function and KEGG pathway enrichment
analysis
The target genes identified from the potent bone-
strengthening and kidney-nourishing formula for OP
treatment were imported into the DAVID database for
enrichment analysis, with a screening threshold set at
p≤0.01. The results were selected in ascending order
by p-value, where a smaller p-value indicates a higher
degree of enrichment. GO function enrichment analysis
categorized the gene functions into three main categories,
including BP, cellular component (CC), and molecular
function (MF). A total of 2,073 GO terms were identified, Figure 2. Potential target PPI network diagram
including 1,637 BP entries, 149 CC entries, and 287 MF Abbreviation: PPI: Protein-protein interaction.
entries. The top 10 terms from each category were selected
and visualized in GO analysis charts using MicroSignal The results indicate that BP mainly involves positive
(Figure 5A). regulation of gene expression, positive regulation of
Volume 9 Issue 2 (2025) 273 doi: 10.36922/EJMO025150103