
Page 286 - EJMO-9-2
P. 286
Eurasian Journal of
Medicine and Oncology QGJSF multi-target mechanisms in osteoporosis
ROC curve analysis was then performed to explore the through ERRα-mediated mitochondrial biogenesis and
diagnostic effects of the seven hub genes. In the GSE35958 regulates MAPK, NF-κB, and NRF2/HO-1 pathways. 12,13
dataset, the area under the curve (AUC) values were as Calycosin inhibits RANKL-induced osteoclastogenesis,
follows: TGFB1, AKT1, CTNNB1, and TP53 all had an upregulates OPG, and activates PI3K/AKT and Wnt/β-
AUC of 1.000, MMP2 was 0.500, BCL2L1 was 0.950, and catenin pathways to support osteoblast function and bone
MAPK3 was 0.750. Except for MMP2, all other genes had mineralization, while its antioxidant properties improve
AUC values >0.7, suggesting good diagnostic performance bone microstructure. 14-16 Berberine reduces oxidative
(Figure 8H). damage, suppresses RANKL/OPG signaling to inhibit
osteoclasts, and promotes osteoblastogenesis through
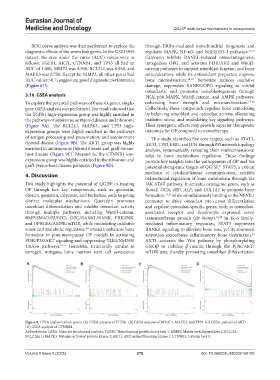
3.10. GSEA analysis PKA, p38 MAPK, Wnt/β-catenin, and AMPK pathways,
To explore the potential pathways of these six genes, single- enhancing bone strength and microarchitecture. 17-20
gene GSEA analysis was performed. The results showed that Collectively, these compounds regulate bone remodeling
the TGFB1 high-expression group was highly enriched in by balancing osteoblast and osteoclast activity, alleviating
the pathways of autoimmune thyroid disease and ribosome oxidative stress, and modulating key signaling pathways.
(Figure 9A). The BCL2L1, MAPK3, and TP53 high- Their synergistic effects may provide superior therapeutic
expression groups were highly enriched in the pathways outcomes for OP compared to monotherapy.
of antigen processing and presentation, and autoimmune This study identified five core targets, such as STAT3,
thyroid disease (Figure 9B). The AKT1 group was highly AKT1, TP53, ESR1, and JUN, through PPI network topology
enriched in autoimmune thyroid disease and graft-versus- analysis, systematically revealing their multidimensional
host disease (Figure 9C). Meanwhile, the CTNNB1 low- roles in bone metabolism regulation. These findings
expression group was highly enriched in the ribosome and provide key insights into the pathogenesis of OP and the
graft-versus-host disease pathways (Figure 9D). potential therapeutic targets of QGJSF. STAT3, a critical
21
4. Discussion mediator of cytokine-kinase communication, exhibits
bidirectional regulation of bone metabolism through the
This study highlights the potential of QGJSF in treating JAK-STAT pathway. It activates osteogenic genes, such as
OP through five key components, such as quercetin, Runx2, OCN, BSP, ALP, and COL1A1 to promote bone
dioscin, genistein, calycosin, and berberine, each targeting formation, 21,22 while simultaneously binding to the NFATc1
distinct molecular mechanisms. Quercetin promotes promoter to drive osteoclast pre-cursor differentiation
osteoblast differentiation and inhibits osteoclast activity and regulate osteoclast-specific genes, such as osteoclast-
through multiple pathways, including Wnt/β-catenin, associated receptor and dendrocyte expressed seven
BMP/SMAD/RUNX2, OPG/RANKL/RANK, ERK/JNK, transmembrane protein (Dc-Stamp). 23,24 In IL-6 family-
and GPRC6A/AMPK/mTOR, while modulating oxidative mediated inflammatory responses, STAT3 suppresses
stress and metabolic regulation. Dioscin enhances bone RANKL signaling to alleviate bone loss, yet its abnormal
8,9
25
formation in post-menopausal OP models by activating activation exacerbates inflammatory bone destruction.
PI3K/P38/AKT signaling and suppressing TLR4/MyD88/ AKT1 activates the Wnt pathway by phosphorylating
TRAF6 pathways. 10,11 Genistein, structurally similar to GSK3β to stabilize β-catenin through the PI3K/AKT/
estrogen, mitigates bone marrow stem cell senescence mTOR axis, thereby promoting osteoblast differentiation
A B C D
Figure 9. GSEA analysis of hub genes. (A) GSEA analysis of TGFB1. (B) GSEA analysis of BCL2L1, MAPK3, and TP53. (C) GSEA analysis of AKT1.
(D) GSEA analysis of CTNNB1.
Abbreviations: GSEA: Gene set enrichment analysis; TGFB1: Transforming growth factor beta 1; MMP2: Matrix metallopeptidase 2; BCL2L1:
BCL2 like 1; MAPK3: Mitogen-activated protein kinase 3; AKT1: AKT serine/threonine kinase 1: CTNNB1: Catenin beta 1.
Volume 9 Issue 2 (2025) 278 doi: 10.36922/EJMO025150103