
Page 284 - EJMO-9-2
P. 284
Eurasian Journal of
Medicine and Oncology QGJSF multi-target mechanisms in osteoporosis
A B
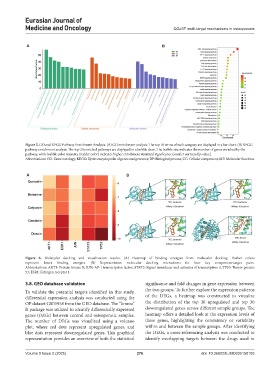
Figure 5. GO and KEGG Pathway Enrichment Analysis. (A) GO enrichment analysis. The top 10 terms of each category are displayed in a bar chart. (B) KEGG
pathway enrichment analysis. The top 20 enriched pathways are displayed in a bubble chart. The bubble size indicates the number of genes enriched by the
pathway, while bubble color intensity (redder color) indicates higher enrichment statistical significance (smaller corrected p-value).
Abbreviations: GO: Gene ontology; KEGG: Kyoto encyclopedia of genes and genomes; BP: Biological process; CC: Cellular component; MF: Molecular function.
A B
Figure 6. Molecular docking and visualization results. (A) Heatmap of binding energies from molecular docking. Darker colors
represent lower binding energies. (B) Representative molecular docking interactions for four key component-target pairs.
Abbreviations: AKT1: Protein kinase B; JUN: AP-1 transcription factor; STAT3: Signal transducer and activator of transcription 3; TP53: Tumor protein
53; ESR1: Estrogen receptor 1.
3.8. GEO database validation significance and fold changes in gene expression between
To validate the potential targets identified in this study, the two groups. To further explore the expression patterns
differential expression analysis was conducted using the of the DEGs, a heatmap was constructed to visualize
OP dataset GSE5958 from the GEO database. The “limma” the distribution of the top 30 upregulated and top 30
R package was utilized to identify differentially expressed downregulated genes across different sample groups. The
genes (DEGs) between control and osteoporotic samples. heatmap offers a detailed look at the expression levels of
The number of DEGs was visualized using a volcano these genes, highlighting the consistency or variability
plot, where red dots represent upregulated genes, and within and between the sample groups. After identifying
blue dots represent downregulated genes. This graphical the DEGs, a cross-referencing analysis was conducted to
representation provides an overview of both the statistical identify overlapping targets between the drugs used in
Volume 9 Issue 2 (2025) 276 doi: 10.36922/EJMO025150103