
Page 220 - EJMO-9-3
P. 220
Eurasian Journal of
Medicine and Oncology FN3K–Nrf2 axis inhibition in breast cancer
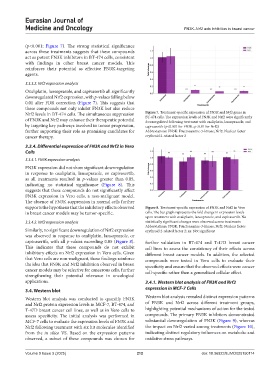
(p<0.001; Figure 7). The strong statistical significance
across these treatments suggests that these compounds
act as potent FN3K inhibitors in BT-474 cells, consistent
with findings in other breast cancer models. This
reinforces their potential as effective FN3K-targeting
agents.
3.3.3.2. Nrf2 expression analysis
Oxaliplatin, lansoprazole, and capivasertib all significantly
downregulated Nrf2 expression, with p-values falling below
0.01 after FDR correction (Figure 7). This suggests that
these compounds not only inhibit FN3K but also reduce
Nrf2 levels in BT-474 cells. The simultaneous suppression Figure 7. Treatment-specific expression of FN3K and Nrf2 genes in
BT-474 cells. The expression levels of FN3K and Nrf2 were significantly
of FN3K and Nrf2 may enhance their therapeutic potential downregulated following treatment with oxaliplatin, lansoprazole, and
by targeting key pathways involved in tumor progression, capivasertib (p<0.001 for FN3K; p<0.01 for Nrf2)
further supporting their role as promising candidates for Abbreviations: FN3K: Fructosamine-3-kinase; Nrf2: Nuclear factor
cancer therapy. erythroid 2-related factor 2
3.3.4. Differential expression of FN3K and Nrf2 in Vero
Cells
3.3.4.1. FN3K expression analysis
FN3K expression did not show significant downregulation
in response to oxaliplatin, lansoprazole, or capivasertib,
as all treatments resulted in p-values greater than 0.05,
indicating no statistical significance (Figure 8). This
suggests that these compounds do not significantly affect
FN3K expression in Vero cells, a non-malignant model.
The absence of FN3K suppression in normal cells further
supports the hypothesis that the inhibitory effects observed Figure 8. Treatment-specific expression of FN3K and Nrf2 in Vero
in breast cancer models may be tumor-specific. cells. The bar graph represents the fold change in expression levels
upon treatment with oxaliplatin, lansoprazole, and capivasertib. No
3.3.4.2. Nrf2 expression analysis statistically significant changes were observed across treatments
Abbreviations: FN3K: Fructosamine-3-kinase; Nrf2: Nuclear factor
Similarly, no significant downregulation of Nrf2 expression erythroid 2-related factor 2; ns: Not significant
was observed in response to oxaliplatin, lansoprazole, or
capivasertib, with all p-values exceeding 0.05 (Figure 8). further validation in BT-474 and T-47D breast cancer
This indicates that these compounds do not exhibit cell lines to assess the consistency of their effects across
inhibitory effects on Nrf2 expression in Vero cells. Given different breast cancer models. In addition, the selected
that Vero cells are non-malignant, these findings reinforce compounds were tested in Vero cells to evaluate their
the idea that FN3K and Nrf2 inhibition observed in breast specificity and ensure that the observed effects were cancer
cancer models may be selective for cancerous cells, further cell-specific rather than a generalized cellular effect.
strengthening their potential relevance in oncological
applications. 3.4.1. Western blot analysis of FN3K and Nrf2
3.4. Western blot expression in MCF-7 Cells
Western blot analysis was conducted to quantify FN3K Western blot analysis revealed distinct expression patterns
and Nrf2 protein expression levels in MCF-7, BT-474, and of FN3K and Nrf2 across different treatment groups,
T-47D breast cancer cell lines, as well as in Vero cells to highlighting potential mechanisms of action for the tested
assess specificity. The initial analysis was performed in compounds. The primary FN3K inhibitors demonstrated
MCF-7 cells to evaluate the expression levels of FN3K and substantial downregulation of FN3K (Figure 9), whereas
Nrf2 following treatment with six hit molecules identified the impact on Nrf2 varied among treatments (Figure 10),
from the in silico VS. Based on the expression patterns indicating distinct regulatory influences on metabolic and
observed, a subset of these compounds was chosen for oxidative stress pathways.
Volume 9 Issue 3 (2025) 212 doi: 10.36922/EJMO025150114