
Page 275 - EJMO-9-3
P. 275
Eurasian Journal of
Medicine and Oncology WGCNA and LASSO for osteoporosis biomarkers
A B
C D
E
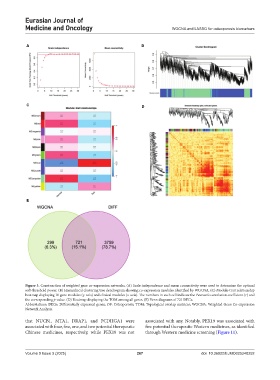
Figure 3. Construction of weighted gene co-expression networks. (A) Scale independence and mean connectivity were used to determine the optimal
soft-threshold power. (B) Hierarchical clustering tree dendrogram showing co-expression modules identified by WGCNA. (C) Module-trait relationship
heatmap displaying 10 gene modules (y-axis) and clinical modules (x-axis). The numbers in each cell indicate the Pearson’s correlation coefficient (r) and
the corresponding p-value. (D) Heatmap displaying the TOM among all genes. (E) Venn diagrams of 721 DEGs.
Abbreviations: DEGs: Differentially expressed genes; OP: Osteoporosis; TOM: Topological overlap matrices; WGCNA: Weighted Gene Co-expression
Network Analysis.
that NUCB1, MTA1, DRAP1, and PCDHGA1 were associated with any. Notably, PEX19 was associated with
associated with four, five, one, and two potential therapeutic five potential therapeutic Western medicines, as identified
Chinese medicines, respectively, while PEX19 was not through Western medicine screening (Figure 11).
Volume 9 Issue 3 (2025) 267 doi: 10.36922/EJMO025240252