
Page 280 - EJMO-9-3
P. 280
Eurasian Journal of
Medicine and Oncology WGCNA and LASSO for osteoporosis biomarkers
A
B
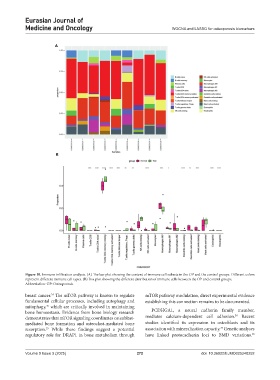
Figure 10. Immune infiltration analysis. (A) The bar plot showing the content of immune cell subsets in the OP and the control groups. Different colors
represent different immune cell types. (B) Box plot showing the different distribution of immune cells between the OP and control groups.
Abbreviation: OP: Osteoporosis.
breast cancer. The mTOR pathway is known to regulate mTOR pathway modulation, direct experimental evidence
34
fundamental cellular processes, including autophagy and establishing this connection remains to be documented.
mitophagy, which are critically involved in maintaining
35
bone homeostasis. Evidence from bone biology research PCDHGA1, a neural cadherin family member,
36
demonstrates that mTOR signaling coordinates osteoblast- mediates calcium-dependent cell adhesion. Recent
mediated bone formation and osteoclast-mediated bone studies identified its expression in osteoblasts and its
resorption. While these findings suggest a potential association with mineralization capacity. Genetic analyses
37
35
regulatory role for DRAP1 in bone metabolism through have linked protocadherin loci to BMD variations.
38
Volume 9 Issue 3 (2025) 272 doi: 10.36922/EJMO025240252