
Page 97 - ESAM-1-2
P. 97
Engineering Science in
Additive Manufacturing Impact of machine factors on PBF part surface quality
A B C
Figure 3. As-built parts are produced using the powder bed fusion system. (A) As-built parts on the substrate plate; (B) parts with labeling from the top
view; (C) front, back, left, and right surfaces of parts.
A B
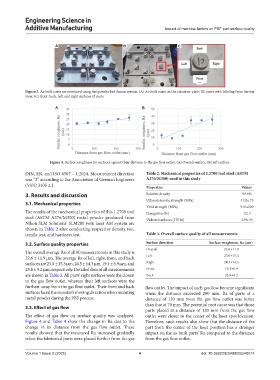
Figure 4. Surface roughness for surfaces against their distance to the gas flow outlet. (A) Overall surface. (B) left surface.
DIN, EN, and ISO 6507 – 1:2024. Measurement direction Table 2. Mechanical properties of 1.2709 tool steel (ASTM
was “2” according to the Association of German Engineers A276/M300) used in this study
(VDI) 3405 2.1. Properties Values
3. Results and discussion Relative density 99.9%
Ultimate tensile strength (MPa) 1135±75
3.1. Mechanical properties
Yield strength (MPa) 915±120
The results of the mechanical properties of this 1.2709 tool Elongation (%) 12±3
steel (ASTM A276/M300) metal powder produced from Vickers hardness (HV10) 339±35
Nikon SLM Solutions’ SLM280 twin laser AM system are
shown in Table 2 after conducting respective density test,
tensile test, and hardness test. Table 3. Overall surface quality of all measurements
3.2. Surface quality properties Surface direction Surface roughness, Ra (μm)
Overall 22.6±11.9
The overall average Ra of all 80 measurements in this study is
22.6 ± 11.9 μm. The average Ra of left, right, front, and back Left 23.0±15.3
surfaces are 23.0 ± 15.3 μm, 24.5 ± 14.3 μm, 19.1 ± 6.9 μm, and Right 24.5±14.3
23.8 ± 9.2 μm, respectively. Detailed data of all measurements Front 19.1±6.9
are shown in Table 3. All parts’ right surfaces were the closest Back 23.8±9.2
to the gas flow outlet, whereas their left surfaces were the
furthest away from the gas flow outlet. Their front and back flow outlet. The impact of such gas flow became significant
surfaces faced the recoater’s moving direction when recoating when the distance exceeded 200 mm. Ra of parts at a
metal powder during the PBF process. distance of 120 mm from the gas flow outlet was better
than that at 70 mm. The potential root cause was that those
3.3. Effect of gas flow
parts placed at a distance of 120 mm from the gas flow
The effect of gas flow on surface quality was analyzed. outlet were closer to the center of the laser spot location.
Figure 4 and Table 4 show the change in Ra due to the Therefore, such results also show that the distance of the
change in its distance from the gas flow outlet. These part from the center of the laser position has a stronger
results showed that the measured Ra increased gradually impact on the as-built parts’ Ra compared to the distance
when the fabricated parts were placed further from the gas from the gas flow outlet.
Volume 1 Issue 2 (2025) 4 doi: 10.36922/ESAM025240014