
Page 138 - GHES-2-1
P. 138
Global Health Econ Sustain Elderly people with dementia
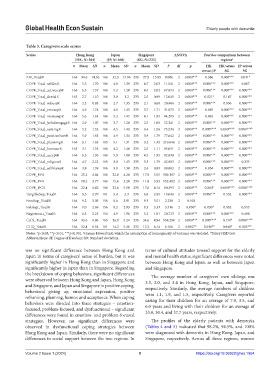
Table 3. Caregivers scale scores
Scales Hong Kong Japan Singapore ANOVA Post hoc comparison between
(HK, N=164) (JP, N=166) (SG, N=233) regions a
n Mean SD n Mean SD n Mean SD F df p HK HK versus JP versus
versus JP SG SG
ZBI_TotalR 164 34.6 14.56 166 32.3 17.86 233 27.9 15.95 9.006 2 0.000*** 0.386 0.000*** 0.031*
COPE_Total_selfdisR 164 5.5 1.70 166 4.8 1.39 233 4.7 2.03 11.541 2 0.000*** 0.000*** 0.000*** 0.807
COPE_Total_activecopR 164 6.5 1.57 166 5.2 1.20 233 4.5 2.02 67.853 2 0.000*** 0.000*** 0.000*** 0.000***
COPE_Total_denialR 163 2.7 1.10 166 3.0 1.2 233 2.5 0.99 12.045 2 0.000*** 0.021* 0.147 0.000***
COPE_Total_subuseR 164 2.2 0.83 166 2.7 1.35 233 2.1 0.60 20.406 2 0.000*** 0.000*** 0.836 0.000***
COPE_Total_emosupR 164 4.9 1.74 166 4.8 1.45 233 3.7 1.71 31.975 2 0.000*** 0.885 0.000*** 0.000***
COPE_Total_instrusupR 164 5.6 1.61 166 5.2 1.47 233 4.1 1.85 44.295 2 0.000*** 0.065 0.000*** 0.000***
COPE_Total_behdisengageR 164 2.9 1.07 166 3.7 1.28 233 2.5 1.08 52.241 2 0.000*** 0.000*** 0.000*** 0.000***
COPE_Total_ventingR 164 5.2 1.52 166 4.5 1.43 233 3.4 1.56 75.536 2 0.000*** 0.000*** b 0.000*** b 0.004*** b
COPE_Total_positiveframR 164 5.9 1.63 166 4.9 1.34 233 3.9 1.79 77.642 2 0.000*** 0.000*** 0.000*** 0.000***
COPE_Total_planningR 164 6.1 1.63 165 5.1 1.31 233 3.2 1.42 210.646 2 0.000*** 0.000*** 0.000*** 0.000***
COPE_Total_humourR 163 3.1 1.35 166 4.2 1.40 233 2.5 1.11 85.051 2 0.000*** 0.000*** 0.000*** 0.000***
COPE_Total_acceptR 164 6.5 1.36 166 5.8 1.08 233 4.5 1.95 82.838 2 0.000*** 0.000*** 0.000*** 0.000***
COPE_Total_religionR 164 4.7 2.22 165 3.0 1.45 233 3.3 1.79 42.903 2 0.000*** 0.000*** 0.000*** 0.335
COPE_Total_selfblameR 164 3.8 1.39 166 3.8 1.38 233 2.4 0.89 98.802 2 0.000*** 0.954 0.000*** 0.000***
COPE_EFR 164 25.2 4.84 166 22.8 4.28 233 17.9 5.55 109.197 2 0.000*** 0.000*** 0.000*** 0.000***
COPE_PFR 164 18.2 3.77 166 15.6 3.20 233 11.8 3.92 152.402 2 0.000*** 0.000*** 0.000*** 0.000***
COPE_DCR 164 22.4 4.42 166 22.6 5.10 233 17.6 4.14 80.393 2 0.000*** 0.864 b 0.000*** b 0.000*** b
TangibleSup_TotalR 164 6.5 2.70 161 5.4 2.3 233 6.8 2.85 13.046 2 0.000*** 0.000*** 0.532 0.000***
EmoSup_TotalR 164 9.2 3.03 156 8.6 2.91 233 9.3 3.51 2.238 2 0.108
InfoSup_TotalR 164 9.0 2.69 156 8.2 2.93 233 8.3 3.33 3.516 2 0.030* 0.030* 0.052 0.955
Neginteract_TotalR 164 6.3 2.23 154 4.9 1.96 233 5.2 1.91 20.723 2 0.000*** 0.000*** 0.000*** 0.488
CJCS_TotalR 164 33.6 4.86 165 26.0 5.24 233 34.6 4.94 158.290 2 0.000*** 0.000*** b 0.150 b 0.000*** b
GHQ_TotalR 164 12.4 6.54 161 14.2 5.46 232 12.2 6.14 6.166 2 0.002** 0.016* b 0.948 b 0.003** b
Notes: *p<0.05; **p<0.01; ***p<0.001. Games-Howell test, which the assumption of homogeneity of variance was violated. Tukey HSD test.
b
a
Abbreviations: df: Degree of freedom; SD: Standard deviation.
was no significant difference between Hong Kong and terms of cultural attitudes toward support for the elderly
Japan in terms of caregivers’ sense of burden, but it was and mental health status, significant differences were noted
significantly higher in Hong Kong than in Singapore and between Hong Kong and Japan, as well as between Japan
significantly higher in Japan than in Singapore. Regarding and Singapore.
the breakdown of coping behaviors, significant differences The average number of caregivers’ own siblings was
were observed between Hong Kong and Japan, Hong Kong 3.3, 2.0, and 3.4 in Hong Kong, Japan, and Singapore,
and Singapore, and Japan and Singapore in positive coping, respectively. Similarly, the average numbers of children
behavioral giving up, emotional expression, positive were 1.1, 1.9, and 1.5, respectively. Caregivers reported
reframing, planning, humor, and acceptance. When coping
behaviors were divided into three strategies – emotion- caring for their children for an average of 7.9, 3.5, and
6.0 years and living with their children for an average of
focused, problem-focused, and dysfunctional – significant
differences were found in emotion- and problem-focused 33.0, 30.4, and 37.7 years, respectively.
strategies. However, no significant differences were The profiles of the elderly patients with dementia
observed in dysfunctional coping strategies between (Tables 4 and 5) indicated that 98.2%, 94.5%, and 100%
Hong Kong and Japan. Similarly, there were no significant were diagnosed with dementia in Hong Kong, Japan, and
differences in social support between the two regions. In Singapore, respectively. Across all three regions, women
Volume 2 Issue 1 (2024) 9 https://doi.org/10.36922/ghes.1954