
Page 139 - GHES-2-1
P. 139
Global Health Econ Sustain Elderly people with dementia
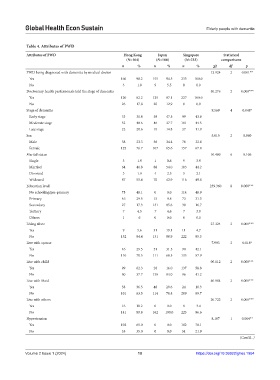
Table 4. Attributes of PWD
Attributes of PWD Hong Kong Japan Singapore Statistical
(N=164) (N=166) (N=233) comparisons
n % n % n % χ2 df p
PWD being diagnosed with dementia by medical doctor 13.924 2 0.001**
Yes 160 98.2 155 94.5 233 100.0
No 3 1.8 9 5.5 0 0.0
Doctor/any health professionals told the stage of dementia 40.276 2 0.000***
Yes 120 82.2 135 87.1 227 100.0
No 26 17.8 20 12.9 0 0.0
Stage of dementia 9.569 4 0.048*
Early stage 33 30.8 58 47.5 99 43.6
Moderate stage 52 48.6 46 37.7 101 44.5
Late stage 22 20.6 18 14.8 27 11.9
Sex 5.615 2 0.060
Male 38 23.3 56 34.4 76 32.6
Female 125 76.7 107 65.6 157 67.4
Marital status 10.480 6 0.106
Single 3 1.9 1 0.6 9 3.9
Married 64 40.8 88 54.0 103 44.2
Divorced 3 1.9 4 2.5 5 2.1
Widowed 87 55.4 70 42.9 116 49.8
Education level 239.360 8 0.000***
No schooling/pre-primary 75 48.1 0 0.0 114 48.9
Primary 46 29.5 15 9.8 73 31.3
Secondary 27 17.3 131 85.6 39 16.7
Tertiary 7 4.5 7 4.6 7 3.0
Others 1 6 0 0.0 0 0.0
Living alone 27.324 2 0.000***
Yes 9 5.6 31 19.1 11 4.7
No 152 94.4 131 80.9 222 95.3
Live with spouse 7.993 2 0.018*
Yes 46 29.5 51 31.5 98 42.1
No 110 70.5 111 68.5 135 57.9
Live with child 90.112 2 0.000***
Yes 99 62.3 26 16.0 137 58.8
No 60 37.7 136 84.0 96 41.2
Live with Maid 40.904 2 0.000***
Yes 58 36.5 48 29.6 24 10.3
No 101 63.5 114 70.4 209 89.7
Live with others 20.722 2 0.000***
Yes 16 10.2 0 0.0 8 3.4
No 141 89.8 162 100.0 225 96.6
Hypertension 8.187 1 0.004**
Yes 102 65.0 0 0.0 182 78.1
No 55 35.0 0 0.0 51 21.9
(Cont’d...)
Volume 2 Issue 1 (2024) 10 https://doi.org/10.36922/ghes.1954