
Page 186 - GHES-2-1
P. 186
Global Health Econ Sustain Income-related inequality in health
suggesting that pro-rich inequality in good SRH is mainly
driven by socioeconomic factors. For ADL ability, 100.95%
of the total inequality disadvantaging the poor with regard
to ADL limitations is driven by income. The contribution
of demographic factors to total inequality is much higher,
reaching around 30%, compared to inequality in SRH. The
contributions of education, residence, and regional factors
to total inequality are 28.76%, −35.71%, and −37.33%,
respectively. In conclusion, a large share of the inequality in
health among older individuals is related to socioeconomic
factors.
Tables S1, S2, and S3 present the results of the
robustness checks that are similar to the main results.
Table S1 demonstrates that for SRH, the unstandardized
EI is 0.014, and the standardized EI is 0.013, suggesting
that the rich are more likely to have good SRH, even after
controlling for demographic factors. For ADL ability,
the unstandardized EI is −0.066 and the standardized
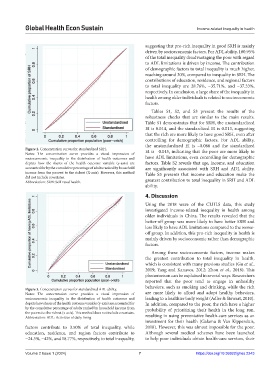
Figure 2. Concentration curves for standardized SRH. EI is −0.045, indicating that the poor are more likely to
Notes: The concentration curve provides a visual impression of
socioeconomic inequality in the distribution of health outcomes and have ADL limitations, even controlling for demographic
depicts how the shares of the health outcome variable (y-axis) are factors. Table S2 reveals that age, income, and education
accounted for by the cumulative percentage of adults ranked by household are significantly associated with SRH and ADL ability.
income from the poorest to the richest (X-axis). However, this method Table S3 presents that income and education make the
did not include covariates.
Abbreviation: SRH: Self-rated health. greatest contribution to total inequality in SRH and ADL
ability.
4. Discussion
Using the 2018 wave of the CLHLS data, this study
investigated income-related inequality in health among
older individuals in China. The results revealed that the
better-off group was more likely to have better SRH and
less likely to have ADL limitations compared to the worse-
off group. In addition, this pro-rich inequality in health is
mainly driven by socioeconomic rather than demographic
factors.
Among these socioeconomic factors, income makes
the greatest contribution to total inequality in health,
which is consistent with many previous studies (Gu et al.,
2019; Yang and Kanavos, 2012; Zhou et al., 2018). This
phenomenon can be explained in several ways. Researchers
reported that the poor tend to engage in unhealthy
behaviors, such as smoking and drinking, while the rich
Figure 3. Concentration curves for standardized ADL ability.
Notes: The concentration curve provides a visual impression of are more likely to afford and adopt healthy behaviors,
socioeconomic inequality in the distribution of health outcomes and leading to a healthier body weight (Adler & Stewart, 2010).
depicts how shares of the health outcome variable (y-axis) are accounted for In addition, compared to the poor, the rich have a higher
by the cumulative percentage of adults ranked by household income from probability of prioritizing their health in the long run,
the poorest to the richest (x-axis). This method does not include covariates.
Abbreviation: ADL: Activities of daily living. resulting in using preventative health-care services as an
investment for their health (Galama & Van Kippersluis,
factors contribute to 3.50% of total inequality, while 2018). However, this was almost impossible for the poor.
education, residence, and region factors contribute to Although several medical schemes have been launched
−24.5%, −42%, and 18.77%, respectively, to total inequality, to help poor individuals obtain health-care services, their
Volume 2 Issue 1 (2024) 7 https://doi.org/10.36922/ghes.2243