
Page 60 - GPD-2-1
P. 60
Gene & Protein in Disease Pyroptosis-related LncRNAs in pediatric AML
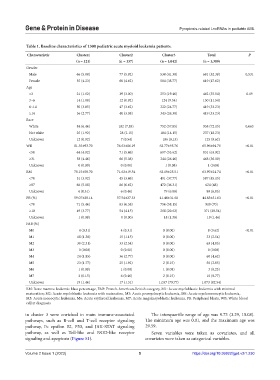
Table 1. Baseline characteristics of 1300 pediatric acute myeloid leukemia patients.
Characteristic Cluster1 Cluster2 Cluster3 Total P
(n = 121) (n = 137) (n = 1,042) (n = 1,300)
Gender
Male 66 (5.08) 77 (5.92) 538 (41.38) 681 (52.38) 0.531
Female 55 (4.23) 60 (4.62) 504 (38.77) 619 (47.62)
Age
<3 21 (1.62) 39 (3.00) 253 (19.46) 462 (35.54) 0.19
3~6 14 (1.08) 12 (0.92) 124 (9.54) 150 (11.54)
6~14 50 (3.85) 47 (3.62) 322 (24.77) 419 (33.23)
≥14 36 (2.77) 40 (3.08) 343 (26.38) 419 (33.23)
Race
White 84 (6.46) 102 (7.85) 752 (57.85) 938 (72.15) 0.663
Not white 25 (1.92) 28 (2.15) 184 (14.15) 237 (18.23)
Unknown 12 (0.92) 7 (0.54) 106 (8.15) 125 (9.62)
WB 81.35±93.70 76.63±86.19 62.77±95.76 65.96±94.76 <0.01
<50 64 (4.92) 71 (5.46) 697 (53.62) 831 (63.92)
≥31 58 (4.46) 66 (5.08) 344 (26.46) 468 (36.00)
Unknown 0 (0.00) 0 (0.00) 1 (0.08) 1 (0.08)
BM 70.15±50.70 71.62±19.54 62.19±25.51 63.97±24.74 <0.01
<70 51 (3.92) 45 (3.46) 491 (37.77) 587 (45.15)
≥87 66 (5.08) 86 (6.62) 472 (36.31) 624 (48)
Unknown 4 (0.31) 6 (0.46) 79 (6.08) 89 (6.85)
PB (%) 59.07±28.14 57.54±27.33 41.46±31.68 44.83±31.63 <0.01
<70 71 (5.46) 83 (6.38) 756 (58.15) 910 (70)
≥10 49 (3.77) 54 (4.15) 268 (20.62) 371 (28.54)
Unknown 1 (0.08) 0 (0.00) 18 (1.38) 19 (1.46)
FAB (%)
M0 4 (0.31) 4 (0.31) 0 (0.00) 8 (0.62) <0.01
M1 18 (1.38) 15 (1.15) 0 (0.00) 33 (2.54)
M2 30 (2.31) 33 (2.54) 0 (0.00) 63 (4.85)
M3 0 (0.00) 0 (0.00) 0 (0.00) 0 (0.00)
M4 24 (1.85) 36 (2.77) 0 (0.00) 60 (4.62)
M5 23 (1.77) 25 (1.92) 2 (0.15) 50 (3.85)
M6 1 (0.08) 1 (0.08) 1 (0.08) 3 (0.23)
M7 2 (0.15) 6 (0.46) 2 (0.15) 10 (0.77)
Unknown 19 (1.46) 17 (1.31) 1,037 (79.77) 1,073 (82.54)
BM: Bone marrow leukemic blast percentage, FAB: French-American-British category, M1: Acute myeloblastic leukemia with minimal
maturation; M2: Acute myeloblastic leukemia with maturation, M3: Acute promyelocytic leukemia, M4: Acute myelomonocytic leukemia,
M5: Acute monocytic leukemia, M6: Acute erythroid leukemia, M7: Acute megakaryoblastic leukemia, PB: Peripheral blasts, WB: White blood
cell at diagnosis
in cluster 3 were enriched in main immune-associated The interquartile range of age was 9.73 (3.29, 15.08).
pathways, such as B-cell and T-cell receptor signaling The minimum age was 0.01, and the maximum age was
pathway, Fc epsilon RI, P53, and JAK-STAT signaling 29.59.
pathway, as well as Toll-like and NOD-like receptor Seven variables were taken as covariates, and all
signaling and apoptosis (Figure S1). covariates were taken as categorical variables.
Volume 2 Issue 1 (2023) 5 https://doi.org/10.36922/gpd.v2i1.230