
Page 62 - GPD-2-1
P. 62
Gene & Protein in Disease Pyroptosis-related LncRNAs in pediatric AML
A B C
D E F
G H I
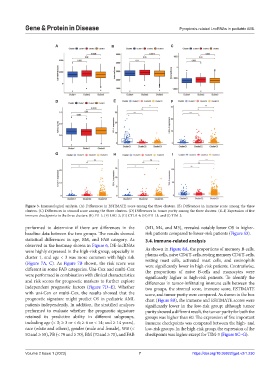
Figure 3. Immunological analysis. (A) Differences in ESTIMATE score among the three clusters. (B) Differences in immune score among the three
clusters. (C) Differences in stromal score among the three clusters. (D) Differences in tumor purity among the three clusters. (E–I) Expression of five
immune checkpoints in the three clusters: (E) PD-1; (F) LAG-3; (G) CTLA-4; (H) PD-L1; and (I) TIM-3.
performed to determine if there are differences in the (M1, M4, and M5), revealed notably lower OS in higher-
baseline data between the two groups. The results showed risk patients compared to lower-risk patients (Figure S3).
statistical differences in age, BM, and FAB category. As 3.4. Immune-related analysis
observed in the heatmap shown in Figure 6, DE-lncRNAs
were highly expressed in the high-risk group, especially in As shown in Figure 8A, the proportions of memory B-cells,
cluster 1, and age < 3 was more common with high risk plasma cells, naive CD4 T-cells, resting memory CD4 T-cells,
(Figure 7A, C). As Figure 7B shown, the risk score was resting mast cells, activated mast cells, and eosinophils
were significantly lower in high-risk patients. Contrariwise,
different in some FAB categories. Uni-Cox and multi-Cox the proportions of naive B-cells and monocytes were
were performed in combination with clinical characteristics significantly higher in high-risk patients. To identify the
and risk scores for prognostic markers to further explore differences in tumor-infiltrating immune cells between the
independent prognostic factors (Figure 7D–E). Whether two groups, the stromal score, immune score, ESTIMATE
with uni-Cox or multi-Cox, the results showed that the score, and tumor purity were compared. As shown in the box
prognostic signature might predict OS in pediatric AML chart (Figure 8B), the immune and ESTIMATE scores were
patients independently. In addition, the stratified analyses significantly lower in the low-risk group; although tumor
performed to evaluate whether the prognostic signature purity showed a different result, the tumor purity for both the
retained its predictive ability in different subgroups, groups was higher than 60. The expression of five important
including age (< 3; ≥ 3 or < 6; ≥ 6 or < 14; and ≥ 14 years), immune checkpoints was compared between the high- and
race (white and others), gender (male and female), WB (< low-risk groups. In the high-risk group, the expression of the
50 and ≥ 50), PB (< 70 and ≥ 70), BM (70 and ≥ 70), and FAB checkpoints was higher except for TIM-3 (Figure 8C–G).
Volume 2 Issue 1 (2023) 7 https://doi.org/10.36922/gpd.v2i1.230