
Page 64 - GPD-2-1
P. 64
Gene & Protein in Disease Pyroptosis-related LncRNAs in pediatric AML
A B C
D E F
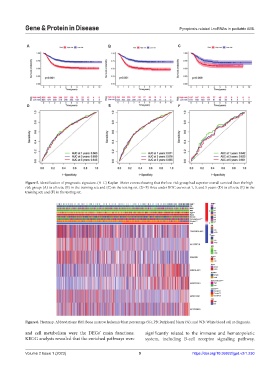
Figure 5. Identification of prognostic signature. (A–C) Kaplan–Meier curves showing that the low-risk group had superior overall survival than the high-
risk group: (A) in all sets; (B) in the training set; and (C) in the testing set. (D–F) Area under ROC curves at 1, 3, and 5 years: (D) in all sets; (E) in the
training set; and (F) in the testing set.
Figure 6. Heatmap. Abbreviations: BM: Bone marrow leukemic blast percentage (%); PB: Peripheral blasts (%); and WB: White blood cell at diagnosis.
and cell metabolism were the DEGs’ main functions. significantly related to the immune and hematopoietic
KEGG analysis revealed that the enriched pathways were system, including B-cell receptor signaling pathway,
Volume 2 Issue 1 (2023) 9 https://doi.org/10.36922/gpd.v2i1.230