
Page 63 - GPD-2-1
P. 63
Gene & Protein in Disease Pyroptosis-related LncRNAs in pediatric AML
A B C
D E F
G H I
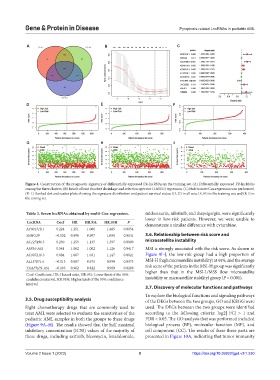
Figure 4. Construction of the prognostic signature of differentially expressed PR-lncRNAs in the training set. (A) Differentially expressed PR-lncRNAs
among the three clusters. (B) Result of least absolute shrinkage and selection operator (LASSO) regression. (C) Multivariate Cox regression was performed.
(D–I) Ranked dot and scatter plots showing the signature distribution and patient survival status: (D, G) in all sets; (E, H) in the training set; and (F, I) in
the testing set.
Table 2. Seven lncRNAs obtained by multi‑Cox regression. midostaurin, nilotinib, and thapsigargin, were significantly
lower in low-risk patients. However, we were unable to
LncRNA Coef HR HR.95L HR.95H P demonstrate a similar difference with cytarabine.
AP001318.1 0.224 1.251 1.068 1.465 0.0054
SNHG29 −0.002 0.998 0.997 1.000 0.0131 3.6. Relationship between risk score and
AC127496.5 0.230 1.259 1.135 1.397 0.0000 microsatellite instability
ASB16-AS1 0.061 1.062 1.002 1.126 0.0417 MSI is strongly associated with the risk score. As shown in
AC007216.3 0.084 1.087 1.031 1.147 0.0021 Figure 9I–J, the low-risk group had a high proportion of
AL157871.6 −0.013 0.987 0.975 0.999 0.0373 MSI-H (high microsatellite instability) at 44%, and the average
TRAF3IP2-AS1 −0.103 0.902 0.822 0.989 0.0288 risk score of the patients in the MSI-H group was significantly
Coef: Coefficient, HR: Hazard ratio, HR.95L: Lower limit of the 95% higher than that in the MSI-L/MSS (low microsatellite
confidence interval, HR.95H: Higher limit of the 95% confidence instability or microsatellite stability) group (P < 0.001).
interval
3.7. Discovery of molecular functions and pathways
To explore the biological functions and signaling pathways
3.5. Drug susceptibility analysis of the DEGs between the two groups, GO and KEGG were
Eight chemotherapy drugs that are commonly used to used. The DEGs between the two groups were identified
treat AML were selected to evaluate the sensitivities of the according to the following criteria: log2| FC| > 1 and
pediatric AML samples in both the groups to these drugs FDR < 0.05. The GO analysis that was performed included
(Figure 9A–H). The results showed that the half maximal biological process (BP), molecular function (MF), and
inhibitory concentration (IC50) values of the majority of cell component (CC). The results of these three parts are
these drugs, including axitinib, bleomycin, lenalidomide, presented in Figure 10A, indicating that tumor immunity
Volume 2 Issue 1 (2023) 8 https://doi.org/10.36922/gpd.v2i1.230