
Page 59 - GPD-2-1
P. 59
Gene & Protein in Disease Pyroptosis-related LncRNAs in pediatric AML
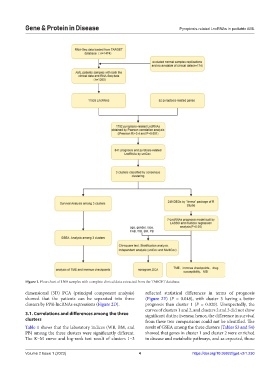
Figure 1. Flow chart of 1300 samples with complete clinical data extracted from the TARGET database.
dimensional (3D) PCA (principal component analysis) reflected statistical differences in terms of prognosis
showed that the patients can be separated into three (Figure 2E) (P = 0.048), with cluster 3 having a better
clusters by PPR-lncRNAs expressions (Figure 2D). prognosis than cluster 1 (P = 0.020). Unexpectedly, the
curves of clusters 1 and 2, and clusters 2 and 3 did not show
3.1. Correlations and differences among the three significant distinctiveness; hence, the difference in survival
clusters from these two comparisons could not be identified. The
Table 1 shows that the laboratory indices (WB, BM, and result of GSEA among the three clusters (Tables S3 and S4)
PB) among the three clusters were significantly different. showed that genes in cluster 1 and cluster 2 were enriched
The K–M curve and log-rank test result of clusters 1–3 in disease and metabolic pathways, and as expected, those
Volume 2 Issue 1 (2023) 4 https://doi.org/10.36922/gpd.v2i1.230