
Page 61 - GPD-2-1
P. 61
Gene & Protein in Disease Pyroptosis-related LncRNAs in pediatric AML
A B C
D E
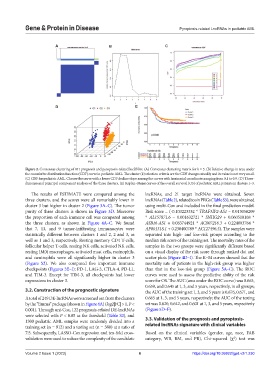
Figure 2. Consensus clustering of 841 prognosis and pyroptosis-related lncRNAs. (A) Consensus clustering matrix for k = 3. (B) Relative change in area under
the cumulative distribution function (CDF) curve in pediatric AML. The cluster (k) selection criteria are the CDF changes steadily and its value is not very small.
(C) CDF for pediatric AML. Choose the curve with a lower CDF decline slope among the curves with horizontal coordinates ranging from 0.1 to 0.9. (D) Three-
dimensional principal component analysis of the three clusters. (E) Kaplan–Meier curves of the overall survival (OS) of pediatric AML patients in clusters 1–3.
The results of ESTIMATE were compared among the lncRNAs, and 21 target lncRNAs were obtained. Seven
three clusters, and the scores were all remarkably lower in lncRNAs (Table 2), related to six PRGs (Table S5), were obtained
cluster 3 but higher in cluster 2 (Figure 3A–C). The tumor using multi-Cox and included in the final prediction model.
purity of three clusters is shown in Figure 3D. Moreover Risk score = (-0.103223332 * TRAF3IP2-AS1 – 0.013058209
the proportion of each immune cell was compared among * AL157871.6 – 0.001632721 * SNHG29 + 0.060510168 *
the three clusters, as shown in Figure 4A–C. We found ASB16-AS1 + 0.083744921 * AC007216.3 + 0.224003784 *
that 7, 13, and 9 tumor-infiltrating immunocytes were AP001318.1 + 0.230400789 * AC127496.5). The samples were
statistically different between clusters 1 and 2, 2 and 3, as separated into high- and low-risk groups according to the
well as 1 and 3, respectively. Resting memory CD4 T-cells, median risk score of the training set. The mortality rates of the
follicular helper T-cells, resting NK cells, activated NK cells, samples in the two groups were significantly different based
resting (M0) macrophages, activated mast cells, eosinophils, on a visual display of the risk score through ranked dot and
and neutrophils were all significantly higher in cluster 3 scatter plots (Figure 4D–I). The K–M curves showed that the
(Figure S2). We also compared five important immune mortality rate of patients in the high-risk group was higher
checkpoints (Figures 3E–I): PD-1, LAG-3, CTLA-4, PD-L1, than that in the low-risk group (Figure 5A–C). The ROC
and TIM-3. Except for TIM-3, all checkpoints had lower curves were used to assess the predictive ability of the risk
expressions in cluster 3. score for OS. The AUC (area under the ROC curve) was 0.663,
0.659, and 0.645 at 1, 3, and 5 years, respectively, in all groups;
3.2. Construction of the prognostic signature the AUC of the training set 1, 3, and 5 years is 0.676, 0.671, and
A total of 249 DE-lncRNAs were screened out from the clusters 0.665 at 1, 3, and 5 years, respectively; the AUC of the testing
by the “limma” package (shown in Figure 4A) (log2|FC| > 1, P < set was 0.620, 0.642, and 0.601 at 1, 3, and 5 years, respectively
0.001). Through uni-Cox, 122 prognosis-related DE-lncRNAs (Figure 5D–F).
were selected with P < 0.05 as the threshold (Table S2), and
1300 pediatric AML samples were randomly divided into a 3.3. Validation of the prognosis and pyroptosis-
training set (n = 912) and a testing set (n = 388) at a ratio of related lncRNAs signature with clinical variables
7:3. Subsequently, LASSO-Cox regression and ten-fold cross- Based on the clinical variables (gender, age, race, FAB
validation were used to reduce the complexity of the candidate category, WB, BM, and PB), Chi-squared (χ ) test was
2
Volume 2 Issue 1 (2023) 6 https://doi.org/10.36922/gpd.v2i1.230