
Page 55 - GPD-3-1
P. 55
Gene & Protein in Disease Prognostic potential of LMNB2 in LPS
A B
C
D
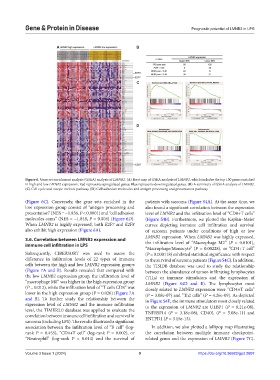
Figure 6. Gene set enrichment analysis (GSEA) analysis of LMNB2. (A) Heat map of GSEA analysis of LMNB2, which includes the top 100 genes enriched
in high and low LMNB2 expression. Red represents upregulated genes; Blue represents downregulated genes. (B) A summary of GSEA analysis of LMNB2.
(C) Cell cycle and oocyte meiosis pathway. (D) Cell adhesion molecules and antigen processing and presentation pathway.
(Figure 6C). Conversely, the gene sets enriched in the patients with sarcoma (Figure S4A). At the same time, we
low expression group consist of “antigen processing and also found a significant correlation between the expression
presentation” (NES = −1.836, P < 0.0001) and “cell adhesion level of LMNB2 and the infiltration level of “CD8+T cells”
molecules cams” (NES = −1.848, P = 0.004) (Figure 6D). (Figure S4B). Furthermore, we plotted the Kaplan–Meier
When LMNB2 is highly expressed, both E2F7 and E2F8 curves depicting immune cell infiltration and survival
also exhibit high expression (Figure 6A). of sarcoma patients under conditions of high or low
LMNB2 expression. When LMNB2 was highly expressed,
3.6. Correlation between LMNB2 expression and
immune cell infiltration in LPS the infiltration level of “Macrophage M2” (P = 0.0101),
“Macrophage/Monocyte” (P = 0.00228), or “CD4+T cell”
Subsequently, CIBERSORT was used to assess the (P = 0.000118) exhibited statistical significance with respect
difference in infiltration levels of 22 types of immune to the survival of sarcoma patients (Figure S4C). In addition,
cells between the high and low LMNB2 expression groups the TISIDB database was used to study the relationship
(Figure 7A and B). Results revealed that compared with between the abundance of tumor-infiltrating lymphocytes
the low LMNB2 expression group, the infiltration level of (TILs) or immune stimulators and the expression of
“macrophage M0” was higher in the high expression group LMNB2 (Figure S4D and E). The lymphocytes most
(P = 0.012), while the infiltration level of “T cells CD8” was closely related to LMNB2 expression were “CD4+T cells”
lower in the high expression group (P = 0.026) (Figure 7A (P = 3.08e-07) and “Th2 cells” (P = 4.26e-09). As depicted
and B). To further study the relationship between the in Figure S4E, the immune stimulators most closely related
expression level of LMNB2 and the immune infiltration to the expression of LMNB2 are ULBP1 (P = 8.21e-08),
level, the TIMER2.0 database was applied to evaluate the TNFRSF14 (P = 3.18e-08), CD40L (P = 5.08e-11) and
correlation between immune cell infiltration and survival in
sarcoma (including LPS). The results illustrated a significant ENTPD1 (P = 3.15e-13).
association between the infiltration level of “B cell” (log- In addition, we also plotted a lollipop map illustrating
rank P = 0.455), “CD4+T cell” (log-rank P = 0.002), or the correlation between multiple immune checkpoint-
“Neutrophil” (log-rank P = 0.014) and the survival of related genes and the expression of LMNB2 (Figure 7C).
Volume 3 Issue 1 (2024) 9 https://doi.org/10.36922/gpd.2607