
Page 52 - GPD-3-1
P. 52
Gene & Protein in Disease Prognostic potential of LMNB2 in LPS
A B C
D
E
F
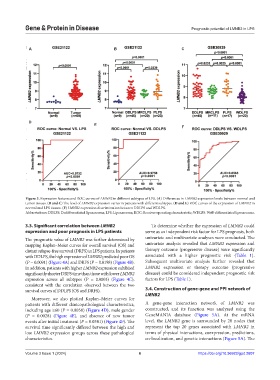
Figure 3. Expression features and ROC curves of LMNB2 in different subtypes of LPS. (A) Differences in LMNB2 expression levels between normal and
tumor tissues. (B and C) The level of LMNB2 expression varies in patients with different subtypes. (D and E) ROC curves of the expression of LMNB2 in
normal and LPS tissues. (F) LMNB2 expression discrimination between DDLPS and WDLPS.
Abbreviations: DDLPS: Dedifferentiated liposarcoma; LPS: Liposarcoma; ROC: Receiver operating characteristic; WDLPS: Well-differentiated liposarcoma.
3.3. Significant correlation between LMNB2 To determine whether the expression of LMNB2 could
expression and poor prognosis in LPS patients serve as an independent risk factor for LPS prognosis, both
The prognostic value of LMNB2 was further determined by univariate and multivariate analyses were conducted. The
mapping Kaplan–Meier curves for overall survival (OS) and univariate analysis revealed that LMNB2 expression and
distant relapse-free survival (DRFS) in LPS patients. In patients therapy outcome (progressive disease) were significantly
with DDLPS, the high expression of LMNB2 predicted poor OS associated with a higher prognostic risk (Table 1).
(P = 0.0091) (Figure 4A) and DRFS (P = 0.0198) (Figure 4B). Subsequent multivariate analysis further revealed that
In addition, patients with higher LMNB2 expression exhibited LMNB2 expression or therapy outcome (progressive
significantly shorter DRFS time than those with lower LMNB2 disease) could be considered independent prognostic risk
expression across all subtypes (P = 0.0003) (Figure 4C), factors for LPS (Table 1).
consistent with the correlation observed between the two
survival curves of DDLPS (OS and DRFS). 3.4. Construction of gene-gene and PPI network of
LMNB2
Moreover, we also plotted Kaplan–Meier curves for
patients with different clinicopathological characteristics, A gene-gene interaction network of LMNB2 was
including age ≥60 (P = 0.0058) (Figure 4D), male gender constructed, and its function was analyzed using the
(P = 0.0028) (Figure 4E), and absence of new tumor GeneMANIA database (Figure 5A). At the mRNA
events after initial treatment (P = 0.0381) (Figure 4F). The level, the LMNB2 gene is surrounded by 20 nodes that
survival time significantly differed between the high and represent the top 20 genes associated with LMNB2 in
low LMNB2 expression groups across these pathological terms of physical interactions, coexpression, predictions,
characteristics. co-localization, and genetic interactions (Figure 5A). The
Volume 3 Issue 1 (2024) 6 https://doi.org/10.36922/gpd.2607