
Page 53 - GPD-3-1
P. 53
Gene & Protein in Disease Prognostic potential of LMNB2 in LPS
A B C
D E F
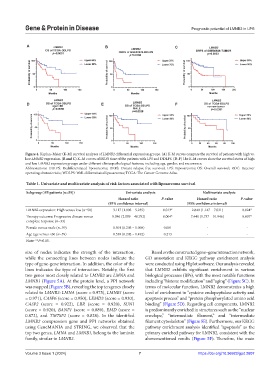
Figure 4. Kaplan–Meier (K-M) survival analyses of LMNB2 differential expression groups. (A) K-M curves compare the survival of patients with high vs.
low LMNB2 expression. (B and C) K–M curves of DRFS time of the patients with LPS and DDLPS. (D-F) The K-M curves show the survival status of high
and low LMNB2 expression groups under different clinicopathological features, including age, gender, and recurrence.
Abbreviations: DDLPS: Dedifferentiated liposarcoma; DRFS: Distant relapse-free survival; LPS: Liposarcoma; OS: Overall survival; ROC: Receiver
operating characteristic; WDLPS: Well-differentiated liposarcoma; TCGA: The Cancer Genome Atlas.
Table 1. Univariate and multivariate analysis of risk factors associated with liposarcoma survival
Subgroup (All patients [n=59]) Univariate analysis Multivariate analysis
Hazard ratio P-value Hazard ratio P-value
(95% confidence interval) (95% confidence interval)
LMNB2 expression: High versus low (n=58) 3.117 (1.003 – 5.235) 0.013* 2.840 (1.147 – 7.031) 0.024*
Therapy outcome: Progressive disease versus 9.046 (2.009 – 40.792) 0.004* 7.448 (1.737 – 31.946) 0.007*
complete response (n=33)
Female versus male (n=59) 0.501 (0.203 – 1.008) 0.081 - -
Age ≥ge versus <60 (n=59) 0.538 (0.202 – 1.492) 0.213 - -
Note: **P<0.05.
size of nodes indicates the strength of the interaction, Based on the constructed gene–gene interaction network,
while the connecting lines between nodes indicate the GO annotation and KEGG pathway enrichment analysis
type of gene-gene interaction. In addition, the color of the were conducted using Hiplot software. Our analysis revealed
lines indicates the type of interaction. Notably, the first that LMNB2 exhibits significant enrichment in various
two genes most closely related to LMNB2 are LMNA and biological processes (BPs), with the most notable functions
LMNB1 (Figure 5A). At the protein level, a PPI network including “histone modification” and “aging” (Figure 5C). In
was mapped (Figure 5B), revealing the top ten genes closely terms of molecular function, LMNB2 demonstrates a high
related to LMNB2: LMNA (score = 0.975), LMNB1 (score level of enrichment in “cysteine endopeptidase activity and
= 0.971), CASP6 (score = 0.950), LEMD3 (score = 0.930), apoptosis process” and “protein phosphorylated amino acid
CASP2 (score = 0.922), LBR (score = 0.920), SUN1 binding” (Figure 5D). Regarding cell components, LMNB2
(score = 0.920), BANF1 (score = 0.889), EMD (score = is predominantly enriched in structures such as the “nuclear
0.872), and TM7SF2 (score = 0.828). In the identified envelope,” “intermediate filament,” and “intermediate
LMNB2 coexpression gene and PPI networks obtained filament cytoskeleton” (Figure 5E). Furthermore, our KEGG
using GeneMANIA and STRING, we observed that the pathway enrichment analysis identified “apoptosis” as the
top two genes, LMNA and LMNB1, belong to the laminin primary enriched pathway for LMNB2, consistent with the
family, similar to LMNB2. abovementioned results (Figure 5F). Therefore, the main
Volume 3 Issue 1 (2024) 7 https://doi.org/10.36922/gpd.2607