
Page 11 - GTM-1-1
P. 11
Global Translational Medicine ZnO NPs induce apoptosis in MG63 cells
A ions. The unique signals were acquired from the
substance-distinct vibrations of the ZnO NPs-coupled
biomolecules (Figure 3). The band at 3424-3452 cm
−1
assisted in determining the functional groups associated
with nanoparticles. The strong, deep absorption peak at
−1
3424 cm represents the stretching of alcohol groups O-H.
The C=C stretching vibrations of primary amines were
responsible for the absorption band at about 1632 cm .
−1
The O-H vibrations of aromatic groups were responsible
for the vibration bounds observed at 1382 cm . The
−1
−1
B 1110 cm band shows the existence of C-O stretching
in alcohol, carboxylic acids, an ester, and other group
compounds. The band verifies the stretching vibration of
ZnO NPs at 452 cm .
−1
3.5. Cytotoxic effect of ZnO NPs on MG63 cells
The ZnO NPs-induced cytotoxic effect on MG63 and
normal Vero cells were determined by MTT assay. The
administration of ZnO NPs has attenuated the cell
proliferation in MG63 cells in a dose-dependent manner.
The concentration of ZnO NPs required for 50% inhibition
of MG63 cells was recorded as 28.12 ± 0.42 µg/mL. As a
result, we selected dosages of 15, 30, and 45 µg/mL for
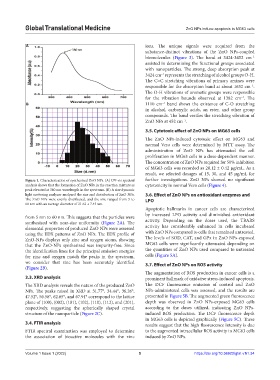
Figure 1. Characterization of synthesized ZnO NPs. (A) UV-vis spectral further investigations. ZnO NPs showed no significant
analysis shows that the formation of ZnO NPs in the reaction mixture as cytotoxicity in normal Vero cells (Figure 4).
peak elevated at 380 nm wavelength in the spectrum. (B) A size dynamic
light scattering analyzer analyzed the size and distribution of ZnO NPs. 3.6. Effect of ZnO NPs on antioxidant enzymes and
The ZnO NPs were evenly distributed, and the size ranged from 5 to LPO
60 nm with an average diameter of 21.62 ± 7.45 nm.
Apoptotic hallmarks in cancer cells are characterized
by increased LPO activity and diminished antioxidant
from 5 nm to 60 nm. This suggests that the particles were
synthesized with near-size uniformity (Figure 2A). The activity. Depending on the doses used, the TBARS
elemental properties of produced ZnO NPs were assessed activity has considerably enhanced in cells incubated
using the EDX patterns of ZnO NPs. The EDX profile of with ZnO NPs compared to cells that remained untreated.
ZnO-NPs displays only zinc and oxygen atoms, showing The levels of SOD, CAT, and GPx in ZnO NPs-exposed
that the ZnO-NPs synthesized was impurity-free. Since MG63 cells were significantly attenuated depending on
the identification lines for the principal emission energies the quantities of ZnO NPs used compared to untreated
for zinc and oxygen match the peaks in the spectrum, cells (Figure 5A).
we consider that zinc has been accurately identified 3.7. Effect of ZnO NPs on ROS activity
(Figure 2B).
The augmentation of ROS production in cancer cells is a
3.3. XRD analysis prominent hallmark of oxidative stress-induced apoptosis.
The XRD analysis reveals the nature of the produced ZnO The DCF fluorescence emission of control and ZnO
NPs. The peaks raised in XRD at 31.77°, 34.44°, 36.26°, NPs-administered cells was assessed, and the results are
47.52°, 56.58°, 62.85°, and 67.91° correspond to the lattice presented in Figure 5B. The augmented green fluorescence
plane of (100), (002), (101), (102), (110), (112), and (201), depth was observed in ZnO NPs-exposed MG63 cells
respectively, suggesting the spherically shaped crystal according to the doses utilized, indicating ZnO NPs-
structure of the nanoparticle (Figure 2C). induced ROS production. The DCF fluorescence depth
in MG63 cells is depicted graphically (Figure 5C). These
3.4. FTIR analysis results suggest that the high fluorescence intensity is due
FTIR spectral examination was employed to determine to the augmented intracellular ROS activity in MG63 cells
the association of bioactive molecules with the zinc induced by ZnO NPs.
Volume 1 Issue 1 (2022) 5 https://doi.org/10.36922/gtm.v1i1.34