
Page 29 - GTM-1-1
P. 29
Global Translational Medicine Inflammatory gene-environment interactions in COPD
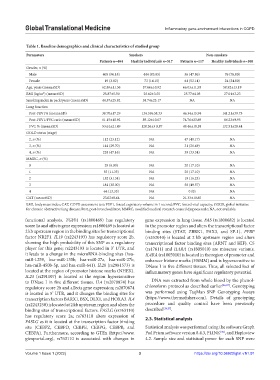
Table 1. Baseline demographics and clinical characteristics of studied group
Parameters Smokers Non‑smokers
Patients n=484 Healthy individuals n=517 Patients n=117 Healthy individuals n=100
Gender, n (%)
Male 465 (96.18) 444 (85.85) 56 (47.86) 76 (76.00)
Female 19 (3.82) 73 (14.15) 61 (52.14) 24 (24.00)
Age, years (mean±SD) 62.89±11.36 57.66±10.92 66.03±11.93 58.92±13.19
BMI (kg/m ) (mean±SD) 25.87±5.50 26.62±3.55 25.77±4.05 27.01±3.23
2
Smoking index in pack/years (mean±SD) 44.57±25.82 38.74±23.17 NA NA
Lung function
Post-FEV1% (mean±SD) 38.70±17.29 136.59±38.33 46.34±15.94 141.21±39.75
Post-FEV1/FVC ratio (mean±SD) 61.15±18.92 89.12±10.07 74.76±23.69 86.23±9.95
FVC % (mean±SD) 53.61±21.49 128.26±3 0.87 49.46±18.58 132.91±28.44
GOLD status (stage)
2, n (%) 112 (23.12) NA 47 (40.17) NA
3, n (%) 144 (29.70) NA 31 (26.49) NA
4, n (%) 228 (47.16) NA 39 (33.34) NA
MMRC, n (%)
0 29 (6.00) NA 20 (17.10) NA
1 55 (11.33) NA 20 (17.10) NA
2 152 (31.34) NA 19 (16.23) NA
3 184 (38.00) NA 58 (49.57) NA
4 64 (13.33) NA 0 (0) NA
CAT (mean±SD) 23.02±8.64 NA 21.33±10.65 NA
BMI, body mass index; CAT, COPD assessment test; FEV1, forced expiratory volume in 1 second; FVC, forced vital capacity; GOLD, global initiative
for chronic obstructive lung disease; Post, post-bronchodilator; MMRC, modified medical research council dyspnea scale; NA, not available.
functional analysis, TGFb1 (rs1800469) has regulatory gene expression in lung tissue. FAS (rs1800682) is located
score 1a and affects gene expression; rs1800469 is located at in the promoter region and alters the transcriptional factor
2 kb upstream region in the binding sites for transcriptional binding sites (STAT, ZBRK1, PAX3, and SP-1). PPBP
factor NR2F1. IL19 (rs2243193) has regulatory score 2b, (rs352010) is located at 2 kb upstream region and alters
showing the high probability of this SNP as a regulatory transcriptional factor binding sites (ARNT and HIF). С5
player for this gene; rs2243193 is located in 3’ UTR, and (rs17611) and IL4RA (rs1805010) are missense variants.
it leads to a change in the microRNA-binding sites (hsa- IL4RA (rs1805010) is located in the region of promoter and
miR-1259, hsa-miR-135b, hsa-miR-27a, hsa-miR-27b, enhancer histone marks (HSMM) and is hypersensitive to
hsa-miR-450b-5p, and hsa-miR-641). IL20 (rs2981573) is DNase I in five different tissues. Thus, all selected loci of
located at the region of promoter histone marks (NHEK). inflammatory genes have significant regulatory potential.
IL24 (rs291107) is located at the region hypersensitive
to DNase I in five different tissues. IL4 (rs2070874) has DNA was extracted from whole blood by the phenol-
regulatory score 2b and affects gene expression; rs2070874 chloroform protocol as described earlier [26,27] . Genotyping
is located in 5’ UTR, and it changes the binding sites for was performed using TaqMan SNP Genotyping Assays
transcription factors BARX1, BSX, DLX1, and HOXA3. IL4 (https://www.thermofisher.com). Details of genotyping
(rs2243250) is located at 2 kb upstream region and alters the procedure and quality control have been previously
binding sites of transcriptional factors. FASLG (rs763110) described [26,27] .
has regulatory score 2a; rs763110 alters expression of 2.3. Statistical analysis
FASLG as it is located at the transcription factor binding
site (CEBPZ, CEBPD, CEBPE, CEBPG, CEBPB, and Statistical analysis was performed using the software Graph
[30]
CEBPA). Furthermore, according to GTEx (https://www. Pad Prism software version 8.4.3, PLINK , and Haploview
gtexportal.org), rs763110 is associated with changes in 4.2. Sample size and statistical power for each SNP were
Volume 1 Issue 1 (2022) 3 https://doi.org/10.36922/gtm.v1i1.91