
Page 32 - GTM-1-1
P. 32
Global Translational Medicine Inflammatory gene-environment interactions in COPD
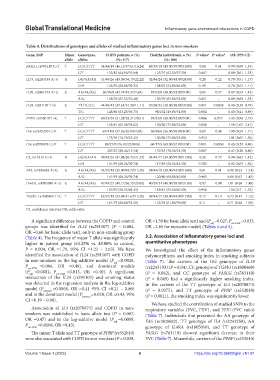
Table 4. Distributions of genotypes and alleles of studied inflammatory genes loci in non‑smokers
Gene, SNP Minor Genotypes, COPD patients, n (%) Healthy individuals, n (%) P‑value a P‑value b OR (95% CI)
allele alleles (N=117) (N=100)
FASLG, rs763110 C>T T CC/CT/TT 54/44/19 (46.15/37.61/16.24) 43/39/18 (43.00/39.00/18.00) 0.88 0.61 0.90 (0.60–1.35)
C/T 152/82 (64.96/35.04) 125/75 (62.50/37.50) 0.667 - 0.89 (0.61–1.33)
IL19, rs2243193 A>G A GG/GA/AA 51/40/26 (43.59/34.19/22.22) 32/44/24 (32.00/44.00/24.00) 0.28 0.22 0.78 (0.51–1.17)
G/A 142/92 (60.68/39.32) 108/92 (54.00/46.00) 0.191 - 0.76 (0.52–1.11)
IL20, rs2981573 A>G G AA/AG/GG 50/58/9 (42.74/49.57/7.69) 39/52/9 (39.00/52.00/9.00) 0.85 0.57 0.87 (0.53–1.42)
A/G 158/76 (67.52/32.48) 130/70 (65.00/35.00) 0.651 - 0.89 (0.60–1.33)
IL24, rs291107 T>C C TT/TC/CC 44/60/13 (37.61/51.28/11.11) 20/58/22 (20.00/58.00/22.00) 0.011 0.0028 0.49 (0.30–0.79)
T/C 148/86 (63.25/36.75) 98/102 (49.00/51.00) 0.004 - 0.60 (0.41–0.89)
PPBP, rs352010 T>C T CC/CT/TT 60/33/24 (51.28/28.21/20.51) 59/32/9 (59.00/32.00/9.00) 0.086 0.075 1.45 (0.96–2.19)
C/T 153/81 (65.38/34.62) 150/50 (75.00/25.00) 0.038 - 1.59 (1.05–2.41)
IL4, rs2243250 C>T T CC/CT/TT 67/41/9 (57.26/35.04/7.69) 56/38/6 (56.00/38.00/6.00) 0.89 0.99 1.00 (0.59–1.71)
C/T 175/59 (74.79/25.21) 150/50 (75.00/25.00) 0.952 - 1.01 (0.65–1.56)
IL4, rs2070874 C>T T CC/CT/TT 90/27/0 (76.92/23.08/0) 60/37/3 (60.00/37.00/3.00) 0.011 0.0058 0.43 (0.23–0.80)
C/T 207/27 (88.46/11.54) 157/43 (78.50/21.50) 0.007 - 0.47 (0.28–0.80)
С5, rs17611 G>A A GG/GA/AA 49/43/25 (41.88/36.75/21.37) 34/49/17 (34.00/49.00/17.00) 0.26 0.77 0.94 (0.62–1.42)
G/A 141/93 (60.26/39.74) 117/83 (58.50/41.50) 0.785 - 0.92 (0.63–1.36)
FAS, rs1800682 A>G G AA/AG/GG 42/57/18 (35.90/48.72/15.38) 38/44/18 (38.00/44.00/18.00) 0.81 0.91 0.98 (0.62 – 1.53)
A/G 141/93 (60.26/39.74) 120/80 (60.00/40.00) 0.965 - 0.98 (0.67 – 1.45)
IL4RA, rs1805010 A>G G AA/AG/GG 47/43/27 (40.17/36.75/23.08) 40/39/21 (40.00/39.00/21.00) 0.97 0.98 1.01 (0.68 – 1.48)
A/G 137/97 (58.55/41.45) 119/81 (59.50/40.50) 0.918 - 1.04 (0.7 – 1.52)
TGFb1, rs1800469 T>C T CC/CT/TT 62/37/18 (52.99/31.62/15.38) 39/44/17 (39.00/44.00/17.00) 0.17 0.14 0.72 (0.47 – 1.12)
C/T 161/73 (68.80/31.20) 122/78 (61.00/39.00) 0.11 - 0.71 (0.48 – 1.05)
CI, confidence interval; OR, odds ratio.
A significant difference between the COPD and control OR =1.59 for basic allele test) and (P =0.027, P cor-FDR =0.033,
adj
groups was identified for IL24 (rs291107) (P = 0.004, OR =2.65 for recessive model) (Tables 4 and 5).
OR =0.60 for basic allele test), only in non-smoking group
(Table 4). The frequency of major T allele was significantly 3.2. Association of inflammatory genes loci and
higher in patient group (63.25% vs. 49.00% in control, quantitative phenotypes
P = 0.004, OR =1.79, 95% CI =1.22 – 2.63). We have We investigated the effect of the inflammatory genes
identified the association of IL24 (rs291107) with COPD polymorphisms and smoking index in smoking subjects
in non-smokers in the log-additive model (P =0.0028, (Table 7). The carriers of the GG genotype of IL19
adj
P cor-FDR =0.006, OR =0.49), and dominant models (rs2243193) (P = 0.04), CC genotype of TGFb1 (rs1800469)
(P adj =0.0082, P cor-FDR =0.013, OR =0.40). A significant (P = 0.042), and CC genotype of FASLG (rs763110)
interaction of the IL24 (rs291107) and smoking status (P = 0.049) had a significantly higher smoking index.
was detected in the regression analysis in the log-additive In the carriers of the TT genotype of IL4 (rs2070874)
model (P interact =0.0068, OR =0.41 95% CI =0.21 – 0.80) (P = 0.0075), and TT genotype of PPBP (rs352010)
and in the dominant model (P interact =0.028, OR =0.43, 95% (P = 0.0021), the smoking index was significantly lower.
CI =0.19 – 0.96).
We have studied the contribution of studied SNPs to the
Association of IL4 (rs2070874) and COPD in non- respiratory variables (FVC, FEV1, and FEV1/FVC ratio)
smokers was established in basic allele test (P = 0.007, (Table 7). Individuals that presented the AA genotype of
OR =0.47) and in the log-additive model (P =0.0058, FAS (rs1800682), TT genotype of IL4 (rs2243250), AA
adj
P cor-FDR =0.0108, OR =0.43). genotype of IL4RA (rs1805010), and TT genotype of
The minor T allele and TT genotype of PPBP (rs352010) FASLG (rs763110) showed significant decrease in their
were also associated with COPD in non-smokers (P = 0.038, FVC (Table 7). Meanwhile, carriers of the PPBP (rs352010)
Volume 1 Issue 1 (2022) 6 https://doi.org/10.36922/gtm.v1i1.91