
Page 30 - GTM-1-1
P. 30
Global Translational Medicine Inflammatory gene-environment interactions in COPD
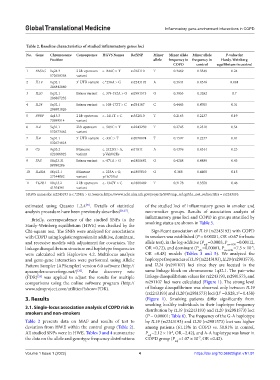
Table 2. Baseline characteristics of studied inflammatory genes loci
No. Gene Chromosome Consequence HGVS Names RefSNP Minor Minor allele Minor allele P‑value for
Position allele frequency in frequency in Hardy‑Weinberg
COPD control equilibrium in control
1 FASLG 1q24.3 2 kb upstream c.-844C > T rs763110 T 0.3469 0.3549 0.24
172658358 variant
2 IL19 1q32.1 3’ UTR variant c.*258A > G rs2243193 A 0.3644 0.4546 0.084
206842880
3 IL20 1q32.1 Intron variant c. 379-152A > G rs2981573 G 0.3053 0.3282 0.7
206867232
4 IL24 1q32.1 Intron variant c. 108-172T > C rs291107 C 0.4443 0.4765 0.31
206901826
5 PPBP 4q13.3 2 kb upstream c.-1411T > C rs352010 T 0.2163 0.2237 0.19
73989514 variant
6 IL4 5q31.1 2kb upstream c.-589C > T rs2243250 T 0.2745 0.2310 0.54
132673462 variant
7 IL4 5q31.1 5’ UTR variant c.-33C > T rs2070874 T 0.1597 0.2277 0.81
132674018
8 С5 9q33.2 Missense c. 2422G > A, rs17611 A 0.4376 0.4344 0.23
121006922 variant p.Val802Ile
9 FAS 10q23.31 Intron variant c.-671A > G rs1800682 G 0.4268 0.4489 0.43
88990206
10 IL4RA 16p12.1 Missense c. 223A > G, rs1805010 G 0.368 0.4408 0.15
27344882 variant p.Ile75Val
11 TGFb1 19q13.2 2 kb upstream c.-1347T > C rs1800469 T 0.3178 0.3558 0.46
41354391 variant
HGVS names for rs2243193 is c.*258A > G. Source: https://www.ncbi.nlm.nih.gov/projects/SNP/snp_ref.cgi?do_not_redirect&rs = rs2243193.
estimated using Quanto 1.2.4 . Details of statistical of the studied loci of inflammatory genes in smoker and
[31]
analysis procedure have been previously described [26,27] . non-smoker groups. Results of association analysis of
Briefly, correspondence of the studied SNPs to the inflammatory gene loci and COPD in groups stratified by
Hardy-Weinberg equilibrium (HWE) was checked by the smoking status are shown in Table 5.
Chi-square test. The SNPs were analyzed for associations Significant association of IL19 (rs2243193) with COPD
with COPD using logistic regression in additive, dominant, in smokers was established (P = 0.00001, OR =0.67 for basic
and recessive models with adjustment for covariates. The allele test), in the log-additive (P =0.0003, P cor-FDR =0.00112,
adj
-5
linkage disequilibrium structure and haplotype frequencies OR =0.72), and dominant (P =0.00001, P cor-FDR =7.5 × 10 ,
adj
were calculated with Haploview 4.2. Multilocus analysis OR =0.48) models (Tables 3 and 5). We analyzed the
and gene-gene interaction were performed using Allelic haplotype frequencies of IL19 (rs2243193), IL20 (rs2981573),
Pattern Sampler (APSampler) version 6.0 software (http:// and IL24 (rs291107) loci since they are located in the
apsampler.sourceforge.net/) . False discovery rate same linkage block on chromosome 1q32.1. The pair-wise
[32]
(FDR) was applied to adjust the results for multiple linkage disequilibrium values for rs2243193, rs2981573, and
[33]
comparisons using the online software program (http:// rs291107 loci were calculated (Figure 1). The strong level
www.sdmproject.com/utilities/?show=FDR). of linkage disequilibrium was observed only between IL19
2
(rs2243193) and IL20 (rs2981573) loci (D’ =0.828, r =0.458)
3. Results (Figure 1). Smoking patients differ significantly from
smoking healthy individuals in their haplotype frequency
3.1. Single-locus association analysis of COPD risk in distribution by IL19 (rs2243193) and IL20 (rs2981573) loci
smokers and non-smokers
(P = 0.00001; Table 6). The frequency of the G-A haplotype
Table 2 presents data on MAF and results of test to by IL19 (rs2243193) and IL20 (rs2981573) loci was higher
deviation from HWE within the control group (Table 2). among patients (61.13% in COPD vs. 50.81% in control,
All studied SNPs were in HWE. Tables 3 and 4 summarize P =2.12 × 10 , OR =2.42), and A-A haplotype was lower in
-6
adj
the data on the allele and genotype frequency distributions COPD group (P =1.07 × 10 , OR =0.42).
-7
adj
Volume 1 Issue 1 (2022) 4 https://doi.org/10.36922/gtm.v1i1.91