
Page 33 - GTM-1-1
P. 33
Global Translational Medicine Inflammatory gene-environment interactions in COPD
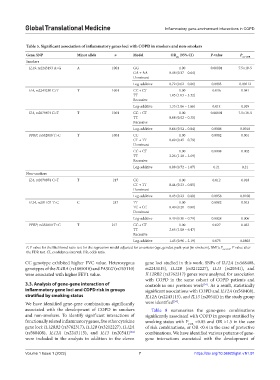
Table 5. Significant association of inflammatory genes loci with COPD in smokers and non‑smokers
Gene, SNP Minor allele n Model OR (95% CI) P‑value P
adj cor‑FDR
Smokers
IL19, rs2243193 A>G A 1001 GG 1.00 0.00001 7.5×10⁻⁵
GA + AA 0.48 (0.37 – 0.64)
Dominant
Log-additive 0.72 (0.62 – 0.86) 0.0003 0.00112
IL4, rs2243250 C>T T 1001 CC + CT 1.00 0.036 0.041
TT 1.85 (1.03 – 3.32)
Recessive
Log-additive 1.33 (1.06 – 1.66) 0.014 0.019
IL4, rs2070874 C>T T 1001 CC + CT 1.00 0.00001 7.5×10⁻⁵
TT 0.08 (0.02 – 0.35)
Recessive
Log-additive 0.66 (0.52 – 0.84) 0.0006 0.0018
PPBP, rs352010 T>C T 1001 CC 1.00 0.0002 0.001
CT + TT 0.60 (0.45 – 0.79)
Dominant
CC + CT 1.00 0.0008 0.002
TT 2.26 (1.38 – 3.69)
Recessive
Log-additive 0.88 (0.72 – 1.07) 0.21 0.21
Non-smokers
IL4, rs2070874 C>T T 217 CC 1.00 0.012 0.018
CT + TT 0.44 (0.23 – 0.85)
Dominant
Log-additive 0.43 (0.23 – 0.80) 0.0058 0.0108
IL24, rs291107 T>C C 217 TT 1.00 0.0082 0.013
TC + CC 0.40 (0.20 – 0.80)
Dominant
Log-additive 0.49 (0.30 – 0.79) 0.0028 0.006
PPBP, rs352010 T>C T 217 CC + CT 1.00 0.027 0.033
TT 2.65 (1.08 – 6.47)
Recessive
Log-additive 1.45 (0.96 – 2.19) 0.075 0.0803
P, P value for the likelihood ratio test for the regression model adjusted for covariates (age, gender, pack-year [in smokers], BMI); P cor-FDR , P value after
the FDR test. CI, confidence interval; OR, odds ratio.
CC genotype exhibited higher FVC value. Heterozygous gene loci studied in this work. SNPs of IL12A (rs568408,
genotypes of the IL4RA (rs1805010) and FASLG (rs763110) rs2243115), IL12B (rs3212227), IL13 (rs20541), and
were associated with higher FEV1 value. IL12RB2 (rs3762317) genes were analyzed for association
with COPD in the same cohort of COPD patients and
3.3. Analysis of gene-gene interaction of controls in our previous work . As a result, statistically
[34]
inflammatory gene loci and COPD risk in groups significant associations with COPD and IL12A (rs568408),
stratified by smoking status IL12A (rs2243115), and IL13 (rs20541) in the study group
[34]
We have identified gene-gene combinations significantly were identified .
associated with the development of COPD in smokers Table 8 summarizes the gene-gene combinations
and non-smokers. To identify significant interactions of significantly associated with COPD in groups stratified by
functionally related inflammatory genes, five other cytokine smoking status with P FDR <0.05 and OR >1.5 in the case
gene loci: IL12RB2 (rs3762317), IL12B (rs3212227), IL12A of risk combinations, or OR <0.4 in the case of protective
(rs568408), IL12A (rs2243115), and IL13 (rs20541) combinations. We have identified various patterns of gene-
[34]
were included in the analysis in addition to the eleven gene interactions associated with the development of
Volume 1 Issue 1 (2022) 7 https://doi.org/10.36922/gtm.v1i1.91