Page 35 - GTM-1-1
P. 35

Global Translational Medicine                              Inflammatory gene-environment interactions in COPD


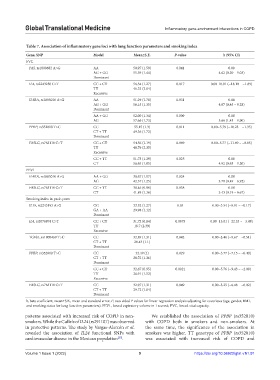
            Table 7. Association of inflammatory gene loci with lung function parameters and smoking index
            Gene, SNP                    Model            Mean±S.E.        P‑value              b (95% CI)
            FVC
             FAS, rs1800682 A>G          AA               50.97 (1.59)      0.041                 0.00
                                         AG + GG          55.59 (1.44)                        4.62 (0.20 – 9.03)
                                         Dominant
             IL4, rs2243250 C>T          CC + CT          56.34 (1.27)      0.017          0.00-10.01 (−18.18 – −1.89)
                                         TT               46.33 (3.04)
                                         Recessive
             IL4RA, rs1805010 A>G        AA               51.29 (1.78)      0.031                 0.00
                                         AG + GG          56.15 (1.35)                        4.87 (0.45 – 9.28)
                                         Dominant
                                         AA + GG          52.00 (1.34)      0.009                 0.00
                                         AG               57.66 (1.73)                        5.66 (1.43 – 9.90)
             PPBP, rs352010 T>C          CC               55.15 (1.3)       0.011          0.00−5.79 (−10.23 – −1.35)
                                         CT + TT          49.36 (1.72)
                                         Dominant
             FASLG, rs763110 C>T         CC + CT          54.56 (1.19)      0.049          0.00−5.77 (−11.49 – −0.05)
                                         TT               48.79 (2.35)
                                         Recessive
                                         CC + TT          51.73 (1.29)      0.025                 0.00
                                         CT               56.65 (1.85)                        4.92 (0.63 – 9.20)
            FEV1
             IL4RA, rs1805010 A>G        AA + GG          38.67 (1.07)      0.024                 0.00
                                         AG               42.37 (1.25)                        3.70 (0.49 – 6.92)
             FASLG, rs763110 C>T         CC + TT          38.46 (0.99)      0.038                 0.00
                                         CT               41.89 (1.36)                        3.43 (0.19 – 6.67)
            Smoking index in pack-years
             IL19, rs2243193 A>G         GG               33.52 (1.27)      0.04           0.00−3.54 (−6.91 – −0.17)
                                         GA + AA          29.98 (1.12)
                                         Dominant
             IL4, rs2070874 C>T          CC + CT          31.72 (0.84)      0.0075         0.00−13.01 (−22.53 – −3.49)
                                         TT               18.7 (2.39)
                                         Recessive
             TGFb1, rs1800469 T>C        CC               32.89 (1.31)      0.042          0.00−3.46 (−9.67 – −0.51)
                                         CT + TT          29.43 (1.1)
                                         Dominant
             PPBP, rs352010 T>C          CC                32.49 (1)        0.029          0.00−3.77 (−7.15 – −0.40)
                                         CT + TT          28.72 (1.36)
                                         Dominant
                                         CC + CT          32.67 (0.95)      0.0021         0.00−5.76 (−9.43 – −2.09)
                                         TT               26.91 (1.52)
                                         Recessive
             FASLG, rs763110 C>T         CC               32.97 (1.31)      0.049          0.00−3.25 (−6.48 – −0.02)
                                         CT + TT          29.72 (1.04)
                                         Dominant
            b, beta coefficient; mean±S.E., mean and standard error; P, two-sided P values for linear regression analysis adjusting for covariates (age, gender, BMI,
            and smoking status for lung function parameters). FEV1, forced expiratory volume in 1 second; FVC, forced vital capacity.

            patterns associated with increased risk of COPD in non-  We established the association of  PPBP  (rs352010)
            smokers. While the C allele of IL24 (rs291107) was observed   with COPD both in smokers and non-smokers. At
            in protective patterns. The study by Vargas-Alarcón et al.   the same time, the significance of the association in
            revealed the association of  IL24  functional SNPs with   smokers was higher. TT  genotype  of  PPBP  (rs352010)
            cardiovascular disease in the Mexican population .  was associated with increased risk of COPD and
                                                   [37]

            Volume 1 Issue 1 (2022)                         9                       https://doi.org/10.36922/gtm.v1i1.91
   30   31   32   33   34   35   36   37   38   39   40