
Page 45 - GTM-1-1
P. 45
Global Translational Medicine Bioinformatics analysis of dilated cardiomyopathy
A B
C
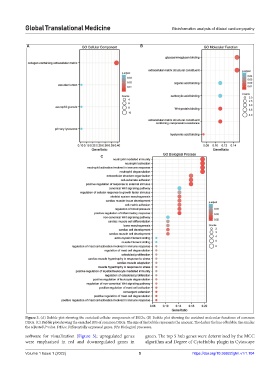
Figure 3. (A) Bubble plot showing the enriched cellular components of DEGs. (B) Bubble plot showing the enriched molecular functions of common
DEGs. (C) Bubble plot showing the enriched BPs of common DEGs. The size of the bubble represents the amount. The darker the hue of bubble, the smaller
the adjusted P value. DEGs: Differentially expressed genes, BPs: Biological processes.
software for visualization (Figure 5); upregulated genes green. The top 5 hub genes were determined by the MCC
were emphasized in red and downregulated genes in algorithm and Degree of CytoHubba plugin in Cytoscape
Volume 1 Issue 1 (2022) 5 https://doi.org/10.36922/gtm.v1i1.104