
Page 50 - GTM-1-1
P. 50
Global Translational Medicine Bioinformatics analysis of dilated cardiomyopathy
A B
C D
E F
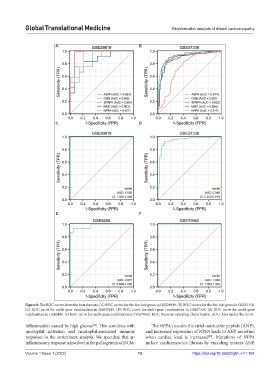
Figure 8. The ROC curves from the four datasets. (A) ROC curves for the five hub genes in GSE29819. (B) ROC curves for the five hub genes in GSE57338.
(C) ROC curve for multi-gene combination in GSE29819. (D) ROC curve for multi-gene combination in GSE57338. (E) ROC curve for multi-gene
combination in GSE5406. (F) ROC curve for multi-gene combination in GSE79662. ROC: Receiver operating characteristic, AUC: Area under the curve.
inflammation caused by high glucose . This correlates with The NPPA encodes the atrial natriuretic peptide (ANP),
[34]
neutrophil activation and neutrophil-associated immune and increased expression of NPPA leads to ANP secretion
responses in the enrichment analysis. We speculate that an when cardiac load is increased . Mutations of NPPA
[35]
inflammatory response is involved in the pathogenesis of DCM. induce cardiomyocyte fibrosis by encoding mutant ANP,
Volume 1 Issue 1 (2022) 10 https://doi.org/10.36922/gtm.v1i1.104