
Page 47 - GTM-1-1
P. 47
Global Translational Medicine Bioinformatics analysis of dilated cardiomyopathy
A B
C D
E
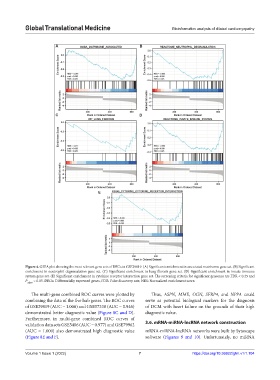
Figure 4. GSEA plot showing the most relevant gene sets of DEGs in GSE29819. (A) Significant enrichment in associated matrisome gene set. (B) Significant
enrichment in neutrophil degranulation gene set. (C) Significant enrichment in lung fibrosis gene set. (D) Significant enrichment in innate immune
system gene set. (E) Significant enrichment in cytokine receptor interaction gene set. The screening criteria for significant genomes are FDR < 0.25 and
P < 0.05. DEGs: Differentially expressed genes, FDR: False discovery rate, NES: Normalized enrichment score.
adjust
The multi-gene combined ROC curves were plotted by Thus, ASPN, MME, OGN, SFRP4, and NPPA could
combining the data of the five hub genes. The ROC curves serve as potential biological markers for the diagnosis
of GSE29819 (AUC = 1.000) and GSE57338 (AUC = 0.946) of DCM with heart failure on the grounds of their high
demonstrated better diagnostic value (Figure 8C and D). diagnostic value.
Furthermore, in multi-gene combined ROC curves of
validation data sets GSE5406 (AUC = 0.977) and GSE79962 3.6. mRNA-miRNA-lncRNA network construction
(AUC = 1.000) also demonstrated high diagnostic value mRNA-miRNA-lncRNA networks were built by Sytoscape
(Figure 8E and F). software (Figures 9 and 10). Unfortunately, no miRNA
Volume 1 Issue 1 (2022) 7 https://doi.org/10.36922/gtm.v1i1.104