
Page 34 - GTM-1-2
P. 34
Global Translational Medicine Proteomic analysis of heart in metabolic cardiomyopathy
blood glucose levels also increased after being fed detected in the HFD group but not in the control group
60% kcal HFD for 5 months. Furthermore, the HFD (Figure 2C).
group with hypertrophic cardiomyocytes had larger
and heavier hearts than the control group (Figure 1B). 3.3. GO analysis of control group-specific DEPs
Echocardiographic measurement showed that the To explore the function of DEPs in the heart tissue of wild-
diastolic function of hearts from HFD-fed mice were type and diabetic mice, we performed GO enrichment
impaired (Figure 1C). analysis for these two groups in the Blast2go (Version 2.5)
program and the GO database. As shown in Figure 3,
3.2. Identification of DEPs
only 74 DEPs were annotated in the GO database among
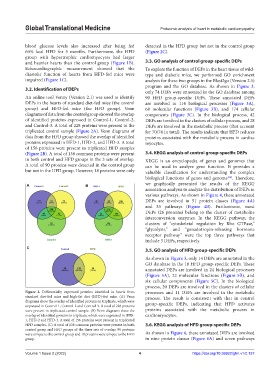
An online tool Venny (Version 2.1) was used to identify 90 HFD group-specific DEPs. These annotated DEPs
DEPs in the hearts of standard diet-fed mice (the control are involved in 114 biological processes (Figure 3A),
group) and HFD-fed mice (the HFD group). Venn 68 molecular functions (Figure 3B), and 174 cellular
diagrams of data from the control group showed the overlap components (Figure 3C). In the biological process, 42
of identified proteins expressed in Control-1, Control-2, DEPs are involved in the clusters of cellular process, and 28
and Control-3. A total of 228 proteins were present in the DEPs are involved in the metabolic process (that account
triplicated control sample (Figure 2A). Venn diagrams of for 70/74 in total). The results indicate that HFD reduces
data from the HFD group showed the overlap of identified proteins associated with the metabolic process in cardiac
proteins expressed in HFD-1, HFD-2, and HFD-3. A total myocytes.
of 156 proteins were present in triplicated HFD samples
(Figure 2B). A total of 138 common proteins were present 3.4. KEGG analysis of control group-specific DEPs
in both control and HFD groups in the 3 sets of overlap. KEGG is an encyclopedia of genes and genomes that
A total of 90 proteins were detected in the control group can be used to analyze gene function. It provides a
but not in the HFD group. However, 18 proteins were only valuable classification for understanding the complex
[16]
biological functions of genes and genome . Therefore,
A B we graphically presented the results of the KEGG
annotation analysis to analyze the distribution of DEPs in
various pathways. As shown in Figure 4, these annotated
DEPs are involved in 51 protein classes (Figure 4A)
and 33 pathways (Figure 4B). Furthermore, most
DEPs (26 proteins) belong to the cluster of metabolite
interconversion enzymes. In the KEGG pathway, the
clusters of “cytoskeletal regulation by Rho GTPase,”
“glycolysis,” and “gonadotropin-releasing hormone
receptor pathway” were the top three pathways that
include 3 DEPs, respectively.
C 3.5. GO analysis of HFD group-specific DEPs
As shown in Figure 3, only 14 DEPs are annotated in the
GO database in the 18 HFD group-specific DEPs. These
annotated DEPs are involved in 24 biological processes
(Figure 5A), 22 molecular functions (Figure 5B), and
six cellular components (Figure 5C). In the biological
process, 20 DEPs are involved in the clusters of cellular
Figure 2. Differentially expressed proteins identified in hearts from processes and 11 DEPs are involved in the metabolic
standard diet-fed mice and high-fat diet (HFD)-fed mice. (A) Venn process. The result is consistent with that in control
diagrams show the overlap of identified proteins in triplicate, which were group-specific DEPs, indicating that HFD activates
expressed in Control-1, Control-2 and Control-3. A total of 228 proteins
were present in triplicated control sample. (B) Venn diagrams show the proteins associated with the metabolic process in
overlap of identified proteins in triplicate, which were expressed in HFD- cardiomyocytes.
1, HFD-2 and HFD-3. A total of 156 proteins were present in triplicated
HFD samples. (C) A total of 138 common proteins were present in both 3.6. KEGG analysis of HFD group-specific DEPs
control group and HFD groups of the three sets of overlap; 90 proteins
were unique to the control group and 18 proteins were unique to the HFD As shown in Figure 6, these annotated DEPs are involved
group. in nine protein classes (Figure 6A) and seven pathways
Volume 1 Issue 2 (2022) 4 https://doi.org/10.36922/gtm.v1i2.137