
Page 48 - GTM-2-2
P. 48
Global Translational Medicine FTO gene and obesity
generally accepted criteria as follows: Normal weight (BMI The cohort included 655 participants: 273 normal
<25); overweight (BMI ≥25 but <30); obesity degree I weight (the median BMI = 21.7 [20.1; 23.4] kg/m ) and
2
2
(BMI ≥30 but <35); obesity degree II (BMI ≥35 but <40); 170 obese (the median BMI = 35.1 [31.8; 37.7] kg/m )
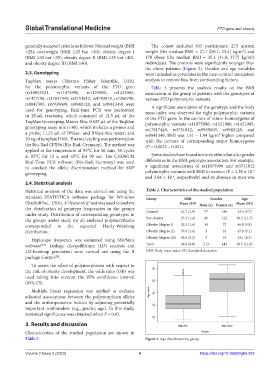
and obesity degree III (BMI ≥40). individuals. The controls were significantly younger than
the obese patients (Figure 2). Gender and age variables
2.3. Genotyping were included as covariates in the case–control association
TaqMan assays (Thermo Fisher Scientific, USA) analysis to remove bias from confounding factors.
for the polymorphic variants of the FTO gene Table 3 presents the analysis results on the BMI
(rs10852521, rs11075990, rs1121980, rs1421085, association in the group of patients with the genotypes of
rs1477196, rs17817449, rs3751812, rs4783819, rs7206790, various FTO polymorphic variants.
rs8047395, rs9939609, rs9940128, and rs9941349) were A significant association of the genotype and the body
used for genotyping. Real-time PCR was performed mass index was observed for eight polymorphic variants
in 25-µL reactions, which consisted of 12.5 µL of the of the FTO gene: In the carriers of minor homozygotes of
TaqMan Genotyping Master Mix; 0.625 µL of the TaqMan polymorphic variants rs11075990, rs1121980, rs1421085,
genotyping assay mix (×40), which includes a primer and rs17817449, rs3751812, rs9939609, rs9940128, and
a probe; 11.25 µL of DNase- and RNase-free water; and rs9941349, BMI was 1.51 – 1.84 kg/m² higher compared
20 ng of template DNA. Thermal cycling was performed on with the carriers of corresponding major homozygotes
the Bio-Rad CFX96 (Bio-Rad, Germany). The method was (P = 0.0022 – 0.021).
applied at the temperature of 95°C for 10 min, 40 cycles
at 95°C for 15 s, and 60°C for 90 sec. The CFX96TM Some studies have found not only ethnic but also gender
Real-Time PCR software (Bio-Rad, Germany) was used differences in the BMI genotype association. For example,
to conduct the allelic discrimination method for SNP a significant association of rs11075990 and rs3751812
-6
genotyping. polymorphic variants with BMI in women (P = 2.26 × 10
and 3.04 × 10 , respectively) and its absence in men was
-6
2.4. Statistical analysis
Statistical analysis of the data was carried out using the Table 2. Characteristics of the studied population
standard STATISTICA software package for Windows Group BMI Gender Age
(StatSoft Inc., USA). A Pearson’s χ test was used to analyze Mean (SD) Male (n) Female (n) Mean (SD)
2
the distribution of genotype frequencies in the groups Control 21.7 (1.9) 77 196 33.3 (9.7)
under study. Distribution of corresponding genotypes in
the groups under study for all analyzed polymorphisms Pre-obesity 27.3 (1.4) 90 122 38.2 (11.7)
corresponded to the expected Hardy-Weinberg Obesity (degree I) 32.3 (1.4) 34 72 46.9 (9.9)
distribution. Obesity (degree II) 37.6 (1.4) 9 33 47.9 (9.1)
Haplotype frequency was estimated using SNPStats Obesity (degree III) 43.6 (3.2) 3 19 53.1 (6.3)
software . Linkage disequilibrium (LD) analysis and Total 26.9 (6.0) 213 442 38.5 (11.8)
[19]
LD-heatmap generation were carried out using the R BMI: Body mass index; SD: Standard deviation
package Gaston .
[20]
To assess the effect of polymorphisms with respect to
the risk of obesity development, the odds ratio (OR) was
used taking into account the 95% confidence interval
(95% CI).
Multiple linear regression was applied to evaluate
adjusted associations between the polymorphism alleles
and the anthropometric indices by adjusting potentially
important confounders (e.g., gender, age). In this study,
statistical significance was obtained when P < 0.05.
3. Results and discussion
Characteristics of the studied population are shown in
Table 2. Figure 2. Age distribution by group.
Volume 2 Issue 2 (2023) 4 https://doi.org/10.36922/gtm.352