
Page 49 - GTM-2-2
P. 49
Global Translational Medicine FTO gene and obesity
[21]
Table 3. Association of the studied polymorphic variants shown . In addition, pronounced population differences
with average BMI values in the Belarusian population were observed for these polymorphic variants – an
association of BMI and a risk for obesity among Europeans
SNP Genotype n Mean BMI Difference P
(SD) (95% CI) was shown, while this kind of relationship was not observed
in Chinese and Hispanic or African Americans .
[22]
rs10852521 C/C 184 27.43 (6.55) 0.00 0.23
C/T 322 26.94 (6.05) −0.49 (−1.59 – 0.61) To conduct a more detailed assessment of the association
T/T 114 26.18 (5.21) −1.25 (−2.66 – 0.17) of polymorphic variants of genes with an obesity progression
risk selected for the study, a BMI > 30 subgroup was formed
rs11075990 A/A 197 25.64 (5.02) 0.00 0.0022 from the general group of patients. Table 4 presents the
A/G 316 27.47 (6.30) 1.83 (0.76 – 2.89) comparison of genotype frequencies in the group of BMI >
G/G 121 27.39 (6.55) 1.74 (0.39 – 3.10) 30 patients in comparison with the BMI < 25 control.
rs1121980 C/C 165 25.72 (5.05) 0.00 0.015 The results demonstrated in Table 4 were fully confirmed by
C/T 340 27.27 (6.19) 1.55 (0.43 – 2.66) the data obtained when comparing the FTO gene association
T/T 130 27.36 (6.56) 1.65 (0.27 – 3.02) with average BMI values in the Belarusian population.
A significant association of the genotype with the body mass
rs1421085 T/T 182 25.95 (5.07) 0.00 0.021 index was observed for the same eight polymorphic variants
C/T 335 27.38 (6.23) 1.43 (0.35 – 2.50)
of the FTO gene. The most significant differences between
C/C 129 27.46 (6.41) 1.51 (0.16 – 2.85) the groups were observed in the distribution of genotypes
rs1477196 G/G 291 27.1 (6.16) 0.00 0.62 of the rs11075990 polymorphic variant (P = 0.0042). The
A/G 281 27.14 (6.00) 0.04 (−0.95 – 1.03) observed differences remained significant after adjustment
for age and gender. The minor G/G genotype was found in
A/A 62 26.33 (5.40) −0.77 (−2.42 – 0.88)
22.5% of obese patients. It turned out to be more frequently
rs17817449 T/T 207 25.78 (5.03) 0.00 0.0027 occurring than the major A/A genotype.
G/T 312 27.48 (6.18) 1.70 (0.66 – 2.73)
In this study, no association of polymorphic variants
G/G 124 27.56 (6.47) 1.77 (0.46 – 3.08)
rs10852521, rs1477196, rs4783819, rs7206790, and
rs3751812 G/G 204 25.88 (5.03) 0.00 0.0072 rs8047395 with a risk for obesity was found. At the same
G/T 319 27.48 (6.24) 1.60 (0.56 – 2.65) time, there is evidence that rs1477196 provokes the
T/T 125 27.41 (6.49) 1.53 (0.20 – 2.85) development of obesity in the case of insufficient physical
[23]
rs4783819 C/C 293 27.05 (6.18) 0.00 0.55 activity , and rs7206790 is associated with a risk of weight
gain, waist circumference and BMI .
[24]
G/C 293 27.1 (5.91) 0.05 (−0.92 – 1.01)
G/G 64 26.21 (5.39) −0.84 (−2.46 – 0.78)
rs7206790 C/C 152 26.41 (5.07) 0.00 0.25
G/C 351 27.33 (6.27) 0.92 (−0.22 – 2.06)
G/G 146 26.79 (6.15) 0.38 (−0.98 – −1.74)
rs8047395 A/A 190 27.24 (6.28) 0.00 0.62
A/G 340 27.03 (6.04) −0.21 (−1.27 – 0.85)
G/G 113 26.55 (5.29) −0.69 (−2.09 – 0.70)
rs9939609 T/T 205 25.83 (5.05) 0.00 0.0037
T/A 319 27.54 (6.26) 1.71 (0.66 – 2.75)
A/A 123 27.47 (6.49) 1.64 (0.31 – 2.97)
rs9940128 G/G 168 25.85 (5.08) 0.00 0.015
A/G 342 27.36 (6.17) 1.51 (0.41 – 2.61)
A/A 138 27.48 (6.39) 1.63 (0.29 – 2.97)
rs9941349 C/C 190 25.73 (5.05) 0.00 0.003
C/T 325 27.41 (6.07) 1.68 (0.63 – 2.73)
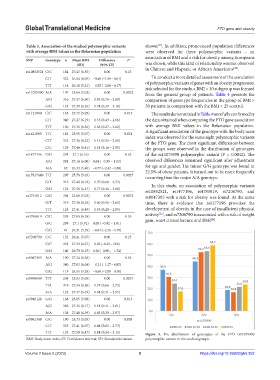
T/T 132 27.58 (6.47) 1.84 (0.54 – 3.15) Figure 3. The distribution of genotypes of the FTO rs11075990
BMI: Body mass index; CI: Confidence interval; SD: Standard deviation. polymorphic variant in the studied groups.
Volume 2 Issue 2 (2023) 5 https://doi.org/10.36922/gtm.352