
Page 62 - GTM-2-3
P. 62
Global Translational Medicine Influence of ferroptosis in neurological diseases
2. Materials and methods 2.2. Reconstruction of protein-protein interaction
networks (PPINs) and identification of functional
2.1. Identification of differentially expressed genes
(DEGs) modules for AD and PD
We used previously available microarray and RNA-seq We utilized only the physical protein–protein interactions
transcriptome data deposited in NCBI (National Center for available in the STRING v11.5 database (https://string-db.
[23]
Biotechnology Information) to identify the DEGs. For AD, we org/) for network reconstruction. To screen the interactors
used data from a previously published study by Guennewig of the DEGs, we employed the STRING application
[21]
et al. , which investigated the disease using samples from programming interface (API) in Python v3.9.2. The resulting
post-mortem brain tissues. We specifically focused on the interactors and DEGs were used to visualize their interaction
genes that showed differential expression in the precuneus network in Cytoscape 3.9.1 . A confidence score >0.7 was
[24]
(AD-PREC) and primary visual cortex (VIC) of the brain. considered for both PPINs. For the detection of important
The identification of DEGs in this study was performed modules from the PPIN in both cases, we used the MCODE
using “edgeR” . Next, we obtained RNA-seq data from the v2.0.0 app in Cytoscape 3.9.1., which identifies densely
[22]
subthalamic nucleus (STN) of post-mortem brain tissues from connected sub-networks considering topological features
PD and non-PD patients, which is accessible in GSE106608. of the main network . Default settings were applied to
[25]
This data allowed us to determine DEGs associated with PD. find clusters within the network. For functional enrichment
Specifically, we compared the transcriptomic data of 7 PD
patients against 9 healthy controls. Table S1 provides patient- analysis of the modules, we used BiNGO in Cytoscape
[26]
specific details of the samples used in these datasets. To 3.9.1 . Subsequently, we identified hubs from the modules
assess batch effects in the RNA-seq datasets, we conducted using Network Analyzer in Cytoscape 3.9.1 to calculate the
the principal component analysis (PCA). We set cutoff values topological features of the network. The mean degree was
of log FC>1.0 and adjusted P < 0.05 across all the studies and considered the cutoff value for identifying hubs from each
2
[27]
datasets to identify significant DEGs. module .
B
A
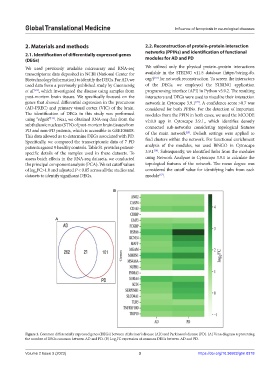
Figure 1. Common differentially expressed genes (DEGs) between Alzheimer’s disease (AD) and Parkinson’s disease (PD). (A) Venn diagram representing
the number of DEGs common between AD and PD. (B) Log FC expression of common DEGs between AD and PD.
2
Volume 2 Issue 3 (2023) 3 https://doi.org/10.36922/gtm.0318