
Page 59 - IJAMD-1-2
P. 59
International Journal of AI for
Materials and Design
AI-assisted ML monitoring in additive auxetics
points on the specimen during deformation. The process field was 9.464e . The evaluated performance metrics
-5
requires prior artificial patterning on the specimen surface demonstrate that the data-driven approach is capable
and algorithms to analyze images and calculate distances. In of accurately predicting effective strain fields, with a
this study, to investigate the strain distribution within the computation speed approximately 10 times faster than
4
specimen and map ML intensity to equivalent strain, DIC FEA (Figure 3A). The training process for each model
measurement was utilized during tensile testing. Strain took 3,456 s (approximately 1 h) on a desktop computer
measurement was conducted using an algorithm provided equipped with an NVIDIA GeForce RTX 4090 GPU. This
by a commercial program (Aramis, Gesellschaft für Optische approach also effectively prevented the checkerboard issue
Messtechnik mbH, Germany), which provided a 0.005% inherent in conventional CNN-based architectures. Thus,
error. The experimental setup included a light-emitting the DL architecture holds promise as an efficient alternative
diode lighting system and two six-megapixel charge- to conventional FEA for evaluating auxetic structures.
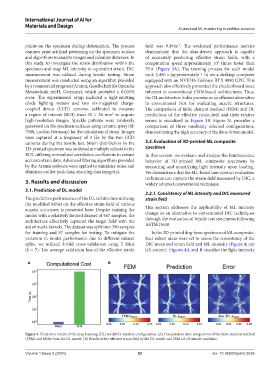
coupled device (CCD) cameras, calibrated to measure The comparison of finite element method (FEM) and DL
a region of interest (ROI) sized 30 × 24 mm to acquire predictions of the effective strain field and their relative
2
high-resolution images. Speckle patterns were randomly errors is visualized in Figure 3B. Figure S1 provides a
generated on the specimen surfaces using ceramic spray (SF comparison of three randomly selected configurations,
7900, Loctite, Germany) for the calculation of strain. Images demonstrating the high accuracy of the data-driven model.
were captured at a frequency of 3 Hz by the two CCD
cameras during the tensile test. Strain distribution in the 3.2. Evaluation of 3D-printed ML composite
3D-printed specimen was analyzed at multiple subsets in the specimen
ROI, utilizing normalized correlation coefficients to extract In this section, we evaluate and analyze the luminescence
accurate strain data. Advanced filtering algorithms provided behavior of 3D-printed ML composite specimens by
by the Aramis software were applied to minimize noise and measuring and quantifying light intensity upon loading.
eliminate outlier peak data, ensuring data integrity). We demonstrate that the ML-based non-contact evaluation
technique can capture the strain field measured by DIC, a
3. Results and discussion widely adopted conventional technique.
3.1. Prediction of DL model
3.2.1. Consistency of ML intensity and DIC measured
The predictive performance of the DL architecture utilizing strain field
the modified MNet on the effective strain field of various
auxetic structures is presented here. Despite training the This section addresses the applicability of ML intensity
model with a relatively limited dataset of 487 samples, the change as an alternative to conventional DIC techniques
architecture effectively captured the target field with the through the evaluation of tensile test specimens following
aid of multi-kernels. The dataset was split into 390 samples ASTM D638.
for training and 97 samples for testing. To mitigate the In the 3D-printed dog-bone specimen of ML composite,
variation in model performance due to different dataset four subset areas were set to assess the consistency of the
splits, we utilized k-fold cross-validation using 5 folds DIC measured strain field and ML intensity (Figure 4; top
(k = 5). The average validation loss of the effective strain left corner). Figures 4A and B visualize the light intensity
A B
Figure 3. Prediction results of the deep learning (DL) model for random configuration. (A) Computation time comparison of the finite element method
(FEM) and MNet from the DL model. (B) Results of the effective strain field by the DL model and FEM a 0.1% tensile condition.
Volume 1 Issue 2 (2024) 53 doi: 10.36922/ijamd.3539