
Page 60 - IJAMD-1-2
P. 60
International Journal of AI for
Materials and Design
AI-assisted ML monitoring in additive auxetics
A B C
D
F
E
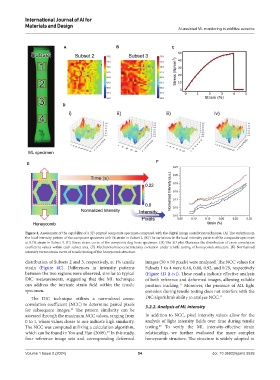
Figure 4. Assessment of the capability of a 3D-printed composite specimen compared with the digital image correlation technique. (A) The variations in
the local intensity pattern of the composite specimen at 0.1% strain in Subset 2. (B) The variations in the local intensity pattern of the composite specimen
at 0.1% strain in Subset 3. (C) Stress-strain curve of the composite dog-bone specimen. (D) The 3D plot illustrates the distribution of cross-correlation
coefficient values within each subset area. (E) Mechanoluminescent intensity evolution under tensile testing of honeycomb structure. (F) Normalized
intensity versus strain curve of tensile testing of the honeycomb structure.
distribution of Subsets 2 and 3, respectively, at 1% tensile images (50 × 50 pixels) were analyzed. The NCC values for
strain (Figure 4C). Differences in intensity patterns Subsets 1 to 4 were 0.48, 0.88, 0.92, and 0.79, respectively
between the two regions were observed, similar to typical (Figure 4D [i-iv]). These results indicate effective analysis
DIC measurements, suggesting that the ML technique of both reference and deformed images, allowing reliable
can address the intricate strain field within the tensile position tracking. Moreover, the presence of ML light
11
specimen. emission during tensile testing does not interfere with the
The DIC technique utilizes a normalized cross- DIC algorithm’s ability to analyze NCC. 11
correlation coefficient (NCC) to determine paired pixels 3.2.2. Analysis of ML intensity
for subsequent images. The pattern similarity can be
11
assessed through the maximum NCC values, ranging from In addition to NCC, pixel intensity values allow for the
0 to 1, where values closer to one indicate high similarity. analysis of light intensity fields over time during tensile
45
The NCC was computed utilizing a calculation algorithm, testing. To verify the ML intensity-effective strain
which can be found in Yoo and Han (2009). In this study, relationship, we further evaluated the more complex
44
four reference image sets and corresponding deformed honeycomb structure. The structure is widely adopted in
Volume 1 Issue 2 (2024) 54 doi: 10.36922/ijamd.3539