
Page 58 - IJAMD-1-2
P. 58
International Journal of AI for
Materials and Design
AI-assisted ML monitoring in additive auxetics
A B
C D
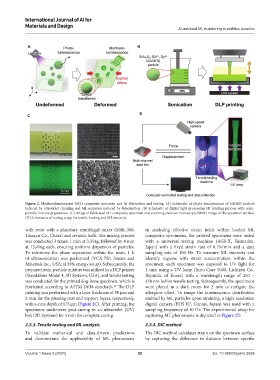
Figure 2. Mechanoluminescent (ML) composite specimen and its fabrication and testing. (A) Schematic of photo-luminescence of SAOED particle
induced by ultraviolet charging and ML emission induced by deformation. (B) Schematic of digital light processing-3D printing process with resin-
particle mixture preparation. (C) Image of fabricated ML composite specimen and scanning electron microscopy (SEM) image of the specimen surface.
(D) Schematics of testing setup for tensile loading and ML intensity.
with resin with a planetary centrifugal mixer (MSK-300, in analyzing effective strain fields within loaded ML
Tmaxcn Co., China) and ceramic balls. The mixing process composite specimens, the printed specimens were tested
was conducted 3 times: 1 min at 3,354g, followed by 4 min with a universal testing machine (AGS-X, Shimadzu,
at 13,416g each, ensuring uniform dispersion of particles. Japan) with a fixed strain rate of 0.1%/min and a data
To minimize the phase separation within the resin, 1 h sampling rate of 100 Hz. To measure ML intensity and
of ultrasonication was performed (VCX-750, Sonics and identify regions with strain concentration within the
Materials Inc., USA; at 38% energy setup). Subsequently, the specimen, each specimen was exposed to UV light for
prepared resin-particle mixture was utilized in a DLP printer 1 min using a UV lamp (Inno-Cure 5000, Lichtzen Co.,
(Standalone Model 4, 3D Systems, USA), and tensile testing Republic of Korea) with a wavelength range of 250 –
was conducted for the printed dog-bone specimen, which is 450 nm before tensile testing. Subsequently, the specimens
fabricated according to ASTM D638 standards. The DLP were placed in a dark room for 2 min to mitigate the
43
printing was performed with a layer thickness of 50 µm and afterglow effect. To image the luminescence distribution
3 mm for the printing part and support layers, respectively, emitted by ML particles upon straining, a high-resolution
with a cure depth of 175 μm (Figure 2C). After printing, the digital camera (EOS R7, Canon, Japan) was used with a
specimens underwent post-curing in an ultraviolet (UV) sampling frequency of 10 Hz. The experimental setup for
box (3D Systems) for 5 min for complete curing. capturing ML phenomena is depicted in Figure 2D.
2.3.3. Tensile testing and ML analysis 2.3.4. DIC method
To validate numerical and data-driven predictions The DIC method calculates strain on the specimen surface
and demonstrate the applicability of ML phenomena by capturing the difference in distance between specific
Volume 1 Issue 2 (2024) 52 doi: 10.36922/ijamd.3539