
Page 56 - IJAMD-1-2
P. 56
International Journal of AI for
Materials and Design
AI-assisted ML monitoring in additive auxetics
A
B
C
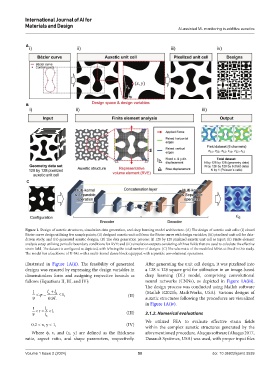
Figure 1. Design of auxetic structures, simulation data generation, and deep learning model architecture. (A) The design of auxetic unit cells: (i) closed
Bézier curve design utilizing few sample points; (ii) designed auxetic unit cell from the Bézier curve with design variables; (iii) pixelized unit cell for data-
driven study; and (iv) generated auxetic designs. (B) The data generation process: (i) 128 by 128 pixelized auxetic unit cell as input; (ii) Finite element
analysis setup utilizing periodic boundary conditions for RVE; and (iii) simulation outputs consisting of three fields that are used to calculate the effective
strain field. The dataset is configured as depicted, with N being the total number of designs. (C) The schematic of the modified MNet utilized in this study.
The model has a backbone of U-Net with a multi-kernel dense block equipped with separable convolutional operations.
illustrated in Figure 1A(ii). The feasibility of generated After generating the unit cell design, it was pixelized into
designs was ensured by expressing the design variables in a 128 × 128 square grid for utilization in an image-based
dimensionless form and assigning respective bounds as deep learning (DL) model, comprising convolutional
follows (Equations II, III, and IV): neural networks (CNNs), as depicted in Figure 1A(iii).
The design process was conducted using Matlab software
1 < ϕ = l a + l b ≤ 1, (Matlab R2021b, MathWorks, USA). Various designs of
9 0.9L (II) auxetic structures following the procedures are visualized
in Figure 1A(iv).
1 <= l a <1,
τ
9 l b (III) 2.1.2. Numerical evaluations
We utilized FEA to evaluate effective strain fields
0.2 < x, y < 1, (IV)
within the complex auxetic structures generated by the
Where φ, τ, and (x, y) are defined as the thickness aforementioned procedure. Abaqus software (Abaqus 2017,
ratio, aspect ratio, and shape parameters, respectively. Dassault Systèmes, USA) was used, with proper input files
Volume 1 Issue 2 (2024) 50 doi: 10.36922/ijamd.3539