
Page 70 - IJAMD-1-2
P. 70
International Journal of AI for
Materials and Design
Machine learning for gel fraction prediction
A
B
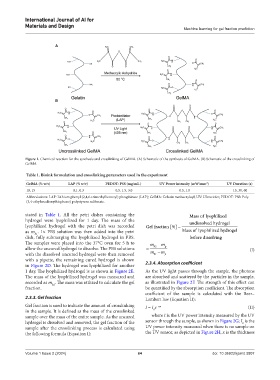
Figure 1. Chemical reaction for the synthesis and crosslinking of GelMA. (A) Schematic of the synthesis of GelMA. (B) Schematic of the crosslinking of
GelMA.
Table 1. Bioink formulation and crosslinking parameters used in the experiment
GelMA (% w/v) LAP (% w/v) PEDOT: PSS (mg/mL ) UV Power intensity (mW/mm ) UV Duration (s)
2
10, 15 0.1, 0.3 0.5, 1.5, 3.0 0.5, 1.0 15, 30, 60
Abbreviations: LAP: Lithium phenyl (2,4,6-trimethylbenzoyl) phosphinate (LAP); GelMA: Gelatin methacryloyl; UV: Ultraviolet; PEDOT: PSS: Poly
(3,4-ethylenedioxythiophene) polystyrene sulfonate.
stated in Table 1. All the petri dishes containing the Mass of lyophilized
hydrogel were lyophilized for 1 day. The mass of the undissolved hydrogel
lyophilized hydrogel with the petri dish was recorded Gelfraction%
as m . 1× PBS solution was then added into the petri Mass of lyyophilized hydrogel
h1
dish, fully submerging the lyophilized hydrogel in PBS. before dissolving
The samples were placed into the 37°C oven for 5 h to m m
allow the uncured hydrogel to dissolve. The PBS solutions h2 p (I)
with the dissolved uncured hydrogel were then removed m h1 m p
with a pipette, the remaining cured hydrogel is shown 2.3.4. Absorption coefficient
in Figure 2D. The hydrogel was lyophilized for another
1 day. The lyophilized hydrogel is as shown in Figure 2E. As the UV light passes through the sample, the photons
The mass of the lyophilized hydrogel was measured and are absorbed and scattered by the particles in the sample,
recorded as m . The mass was utilized to calculate the gel as illustrated in Figure 2F. The strength of this effect can
h2
fraction. be quantified by the absorption coefficient. The absorption
coefficient of the sample is calculated with the Beer–
2.3.3. Gel fraction Lambert law (Equation II):
Gel fraction is used to indicate the amount of crosslinking I = I e −ax (II)
in the sample. It is defined as the mass of the crosslinked 0
sample over the mass of the entire sample. As the uncured where I is the UV power intensity measured by the UV
hydrogel is dissolved and removed, the gel fraction of the sensor through the sample, as shown in Figure 2G; I is the
0
sample after the crosslinking process is calculated using UV power intensity measured when there is no sample on
the following formula (Equation I): the UV sensor, as depicted in Figure 2H; x is the thickness
Volume 1 Issue 2 (2024) 64 doi: 10.36922/ijamd.3807