
Page 75 - IJAMD-1-2
P. 75
International Journal of AI for
Materials and Design
Machine learning for gel fraction prediction
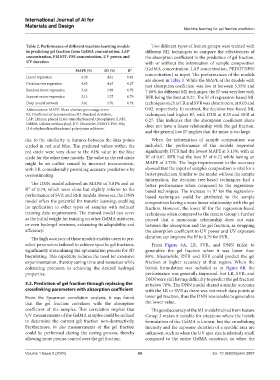
Table 2. Performance of different machine learning models Two different types of feature groups were trained with
in predicting gel fraction from GelMA concentration, LAP different ML techniques to compare the effectiveness of
concentration, PEDOT: PSS concentration, UV power, and the absorption coefficient in the prediction of gel fraction,
UV duration with or without the information of sample composition
MAPE (%) SD (%) R² (GelMA concentration, LAP concentration, PEDOT:SPSS
Linear regression 6.28 4.61 0.41 concentration) as input. The performances of the models
are shown in Table 3. While the MAPE of the models with
Decision tree regression 4.05 4.63 0.67 just absorption coefficient was low at between 5.55% and
Random forest regression 3.42 3.99 0.76 7.88% for different ML technique, the R was very low with
2
Support vector regression 3.13 3.75 0.79 RFR being the best at 0.27. The R of regression-based ML
2
Deep neural network 3.81 3.70 0.74 techniques such as LR and SVR was close to zero, at 0.03 and
Abbreviations: MAPE: Mean absolute percentage error; 0.02, respectively. In contrast, the decision tree-based ML
2
R2: Coefficient of determination; SD: Standard deviation, techniques had higher R , with DTR at 0.25 and RFR at
LAP: Lithium phenyl (2,4,6-trimethylbenzoyl) phosphinate (LAP), 0.27. This indicates that the absorption coefficient alone
GelMA: Gelatin methacryloyl, UV: Ultraviolet, PEDOT: PSS: Poly does not have a linear relationship with the gel fraction,
(3,4-ethylenedioxythiophene) polystyrene sulfonate.
and the general low R implies that the noise is too large.
2
due to the similarity in features between the data points When the information of sample composition was
circled in red and blue. The predicted values within the included, the performance of the models improved
red circle were very close to the 61% value in the blue significantly. DTR had the lowest MAPE at 3.13%, with an
2
2
circle for the other four models. The value in the red circle R of 0.67. RFR had the best R of 0.72 while having an
might be an outlier caused by incorrect measurement, MAPE of 3.79%. The huge improvement in the accuracy
with LR coincidentally providing accurate predictions by showed that the input of sample’s composition is vital for a
overestimating. better prediction. Similar to the model without the sample
information, the decision tree-based techniques had a
The DNN model achieved an MAPE of 3.81% and an better performance when compared to the regression-
R² of 0.74, which were close but slightly inferior to the based techniques. The increase in R for the regression-
2
performance of SVR and RFR models. However, the DNN based techniques could be attributed to the sample
model offers the potential for transfer learning, enabling composition having a more linear relationship with the gel
its application to other types of samples with reduced fraction. However, the lower R for the regression-based
2
training data requirements. The trained model can serve techniques when compared to the feature Group 1 further
as the initial weight for training on other GelMA mixtures, proved that a monotonic relationship does not exist
or even hydrogel mixtures, enhancing its adaptability and between the absorption and the gel fraction, as swapping
efficiency. the absorption coefficient to UV power and UV exposure
2
The high accuracy of these models enables users to pre- duration can improve the R to 0.79 for SVR.
select parameters tailored to achieve specific gel fractions, From Figure 6A, LR, SVR, and DNN failed to
significantly streamlining the optimization process for 3D generalize the gel fraction when it was lower than
bioprinting. This capability reduces the need for extensive 80%. Meanwhile, DTR and RFR could predict the gel
experimentation, thereby saving time and resources while fraction at higher accuracy at that region. When the
enhancing precision in achieving the desired hydrogel bioink formulation was included as in Figure 6B, the
properties. performance was generally improved, but LR, SVR, and
DNN were still having difficulty to predict the gel fraction
3.2. Prediction of gel fraction through replacing the at below 70%. The DNN model shared a similar outcome
crosslinking parameters with absorption coefficient with the LR or SVR as there was not much data points at
From the Spearman correlation analysis, it was found lower gel fraction, thus the DNN was unable to generalize
that the gel fraction correlates with the absorption the lower value.
coefficient of the samples. This correlation implies that The good accuracy of the ML model trained from feature
UV measurements of the GelMA samples could be utilized Group 3 makes it suitable for situations where the bioink
to determine the current gel fraction non-destructively. formulation of the GelMA is known, but the crosslinking
Furthermore, in situ measurements of the gel fraction intensity and the exposure duration of a specific area are
could be performed during the curing process, thereby unknown, such as when the UV spot size is relatively small
allowing more precise control over the gel fraction. compared to the entire GelMA construct, or when the
Volume 1 Issue 2 (2024) 69 doi: 10.36922/ijamd.3807