
Page 76 - IJAMD-1-2
P. 76
International Journal of AI for
Materials and Design
Machine learning for gel fraction prediction
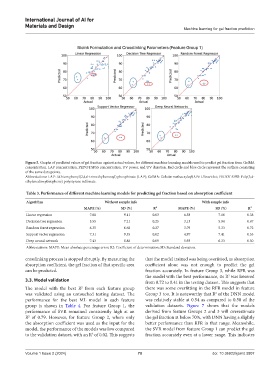
Figure 5. Graphs of predicted values of gel fraction against actual values, for different machine learning models used to predict gel fraction from GelMA
concentration, LAP concentration, PEDOT:SPSS concentration, UV power, and UV duration. Red circle and blue circle represent the outliers consisting
of the same data points.
Abbreviations: LAP: Lithium phenyl(2,4,6-trimethylbenzoyl) phosphinate (LAP); GelMA: Gelatin methacryloyl; UV: Ultraviolet; PEDOT:SPSS: Poly(3,4-
ethylenedioxythiophene) polystyrene sulfonate.
Table 3. Performance of different machine learning models for predicting gel fraction based on absorption coefficient
Algorithm Without sample info With sample info
MAPE (%) SD (%) R² MAPE (%) SD (%) R²
Linear regression 7.88 9.11 0.03 6.58 7.16 0.38
Decision tree regression 5.55 7.21 0.25 3.13 5.94 0.67
Random forest regression 6.35 6.68 0.27 3.79 5.33 0.72
Support vector regression 7.31 9.35 0.02 4.97 7.41 0.53
Deep neural network 7.43 8.88 0.09 5.93 6.33 0.50
Abbreviations: MAPE: Mean absolute percentage error; R2: Coefficient of determination; SD: Standard deviation.
crosslinking process is stopped abruptly. By measuring the that the model trained was being overfitted, as absorption
absorption coefficient, the gel fraction of that specific area coefficient alone was not enough to predict the gel
can be predicted. fraction accurately. In feature Group 3, while RFR was
the model with the best performance, its R was lowered
2
3.3. Model validation from 0.72 to 0.41 in the testing dataset. This suggests that
The model with the best R from each feature group there was some overfitting in the RFR model in feature
2
was validated using an untouched testing dataset. The Group 3 too. It is noteworthy that R of the DNN model
2
performance for the best ML model in each feature was relatively stable at 0.54 as compared to 0.50 of the
group is shown in Table 4. For feature Group 1, the validation datasets. Figure 7 shows that the models
performance of SVR remained consistently high at an derived from feature Groups 2 and 3 will overestimate
R of 0.79. However, for feature Group 2, where only the gel fraction at below 70%, with DNN having a slightly
2
the absorption coefficient was used as the input for the better performance than RFR in that range. Meanwhile,
model, the performance of the models was low compared the SVR model from feature Group 1 can predict the gel
to the validation dataset, with an R of 0.02. This suggests fraction accurately even at a lower range. This indicates
2
Volume 1 Issue 2 (2024) 70 doi: 10.36922/ijamd.3807