
Page 74 - IJAMD-1-2
P. 74
International Journal of AI for
Materials and Design
Machine learning for gel fraction prediction
3.1. Prediction of gel fraction from bioink Gel (%)=1.719x GelMA +17.26x LAP -3.814x PEDOT +9.560x +0.106
P
formulations and crosslinking parameters 4x +56.29 (V)
t
The performance metrics for each ML technique used to From the equation, it can be inferred that the increase in
train the model are presented in Table 2. SVR exhibited GelMA concentration, LAP concentration, UV power, and
the best performance, achieving an MAPE of 3.13%, a UV duration will result in a higher gel fraction. Conversely,
standard deviation (SD) of 3.75%, and a coefficient of an increase in the concentration of PEDOT:SPSS will lower
2
determination (R ) of 0.79. These results indicate that the the resultant gel fraction. These findings are consistent
model has a very good fit and can accurately predict the gel with the conclusions drawn from the Spearman correlation
fraction. In contrast, LR demonstrated the lowest accuracy, analysis.
with an MAPE of 6.28%, an SD of 4.61%, and the lowest Figure 5 illustrates the plot of predicted gel fraction
R at 0.41. Nonetheless, this still represents a reasonably against actual gel fraction for the validation dataset.
2
good accuracy, suggesting that the input features provide Although the LR models exhibited lower overall accuracy,
sufficient information to predict the gel fraction effectively. it accurately predicted an outlier circled in red, a feat
not achieved by the other four models. Conversely, LR
Although LR provides the lowest accuracy, it is valuable struggled to predict the gel fraction at the lower end of
for gaining insights into the relationships between variables. the dataset, as indicated by the blue circle, where the other
The LR model can be summarized by Equation V: models performed accurately. This discrepancy was likely
A
B C
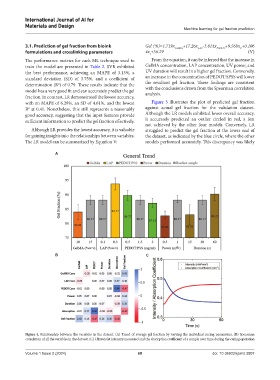
Figure 4. Relationship between the variables in the dataset. (A) Trend of average gel fraction by varying the individual curing parameters. (B) Spearman
correlation of all the variables in the dataset. (C) Ultraviolet intensity measured and the absorption coefficient of a sample over time during the curing operation
Volume 1 Issue 2 (2024) 68 doi: 10.36922/ijamd.3807