
Page 28 - IJAMD-1-3
P. 28
International Journal of AI for
Materials and Design
Prediction of wall geometry for wire arc additive manufacturing
on various process parameters is critical in this regard. 2. Methodology
Xiong et al. developed models that linked the process
27
parameters of GMAW-based WAAM (WFS, TS, V, and 2.1. Experimental setup
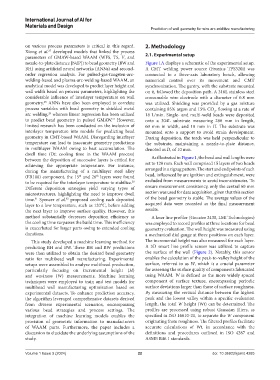
nozzle-to-plate distance [NdP]) to bead geometry (BW and Figure 1A displays a schematic of the experimental setup.
BH) using artificial neural networks (ANNs) and second- A CMT welding power source (Fronius TPS320i) was
order regression analysis. For pulsed-gas-tungsten-arc- connected to a three-axis laboratory bench, allowing
welding-based and plasma-arc-welding-based WAAM, an numerical control over its movement and CMT
analytical model was developed to predict layer height and synchronization. The gantry, with the substrate mounted
wall width based on process parameters, highlighting the on it, followed the deposition path. A 316L stainless steel
considerable influence of interlayer temperature on wall consumable wire electrode with a diameter of 0.8 mm
geometry. ANNs have also been employed to correlate was utilized. Shielding was provided by a gas mixture
28
process variables with bead geometry in shielded metal containing 85% argon and 15% CO , flowing at a rate of
2
arc welding, whereas linear regression has been utilized 18 L/min. Single- and multi-weld beads were deposited
29
to predict bead geometry in pulsed GMAW. However, onto a 304L substrate measuring 280 mm in length,
21
limited research has been conducted on the inclusion of 60 mm in width, and 10 mm in H. The substrate was
interlayer temperature into models for predicting bead mounted onto a support to avoid strain development.
geometry in CMT-based WAAM. Disregarding interlayer During deposition, the torch was held perpendicular to
temperature can lead to inaccurate geometry predictions the substrate, maintaining a nozzle-to-plate distance,
in multilayer WAAM owing to heat accumulation. The denoted as D, of 10 mm.
dwell time (Dt; cooling time in the WAAM process)
between the deposition of successive layers is critical for As illustrated in Figure 1, the bead and wall lengths were
achieving the appropriate temperature. For instance, set to 120 mm. Each wall comprised 15 layers of two beads
during the manufacturing of a multilayer steel alloy arranged in a zigzag pattern. The start and end points of each
(ER100) component, the 15 and 26 layers were found bead, influenced by arc ignition and extinguishment, were
th
th
to be required for the interlayer temperature to stabilize. excluded from measurements to avoid inconsistencies. To
30
Different deposition strategies yield varying types of ensure measurement consistency, only the central 60 mm
microstructures, highlighting the need to improve dwell section was used for data acquisition, given that this section
31
time. Spencer et al. proposed cooling each deposited of the bead geometry is stable. The average values of the
32
layer to a low temperature, such as 120°C, before adding acquired data were recorded as the final measurement
the next layer to improve surface quality. However, this results.
method substantially decreases deposition efficiency as A laser line profiler (Gocator 2430, LMI Technologies)
the cooling time surpasses the build time. This inefficiency was employed to record profiles at three locations for bead
is exacerbated for larger parts owing to extended cooling geometry evaluation. The wall height was measured using
durations. a mechanical dial gauge at three positions on each layer.
This study developed a machine learning method for The incremental height was also measured for each layer.
predicting BH and BW. These BH and BW predictions A 3D smart line profile sensor was utilized to capture
were then utilized to obtain the desired bead geometry the surface of the wall (Figure 2). Notably, this sensor
ratio for multibead wall manufacturing. Experimental enables the calculation of the peak-to-valley height of the
setups were assembled to analyze multibead production, surface, referred to as W, which is a crucial parameter
particularly focusing on incremental height (H) for assessing the surface quality of components fabricated
and waviness (W) measurements. Machine learning using WAAM. W is defined as the more widely spaced
techniques were employed to train and test models for component of surface texture, encompassing periodic
multibead wall manufacturing optimization based on surface deviations larger than those of surface roughness.
experimental datasets. To enhance prediction accuracy, By measuring the vertical distance between the highest
the algorithm leveraged comprehensive datasets derived peak and the lowest valley within a specific evaluation
from diverse experimental scenarios, encompassing length, the total W height (Wt) can be determined. The
various bead strategies and process settings. The profiles are processed using robust Gaussian filters, as
integration of machine learning models enables the specified in ISO 16610-21, to separate the W component
provision of geometric information to manufacturers originating from roughness. The filtered profiles facilitate
of WAAM parts. Furthermore, the paper includes a accurate calculations of Wt, in accordance with the
discussion to elucidate the underlying assumptions of the definitions and procedures outlined in ISO 4287 and
study. ASME B46.1 standards.
Volume 1 Issue 3 (2024) 22 doi: 10.36922/ijamd.4285