
Page 33 - IJAMD-1-3
P. 33
International Journal of AI for
Materials and Design
Prediction of wall geometry for wire arc additive manufacturing
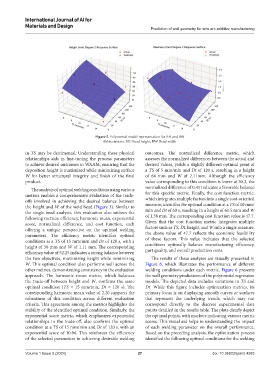
Figure 5. Polynomial model representation for BH and BW
Abbreviations: BH: Bead height; BW: Bead width.
in TS may be detrimental. Understanding these physical outcomes. The normalized difference metric, which
relationships aids in fine-tuning the process parameters assesses the normalized differences between the actual and
to achieve desired outcomes in WAAM, ensuring that the desired values, yields a slightly different optimal point at
deposition height is maximized while minimizing surface a TS of 5 mm/min and Dt of 120 s, resulting in a height
W for better structural integrity and finish of the final of 64 mm and W of 2.11mm. Although the efficiency
product. value corresponding to this condition is lower at 30.3, the
The analysis of optimal welding conditions using various normalized difference of 0.41 indicates a favorable balance
metrics enables a comprehensive evaluation of the trade- for this specific metric. Finally, the cost function metric,
offs involved in achieving the desired balance between which integrates multiple factors into a single cost-oriented
the height and W of the weld bead (Figure 3). Similar to measure, identifies the optimal condition at a TS of 10 mm/
the single-bead analysis, this evaluation also utilizes the min and Dt of 60 s, resulting in a height of 61.5 mm and W
following metrics: efficiency, harmonic mean, exponential of 1.38 mm. The corresponding cost function value is 47.7.
score, normalized difference, and cost function, each Given that the cost function metric integrates multiple
offering a unique perspective on the optimal welding factors such as TS, Dt, height, and W into a single measure,
parameters. The efficiency metric identifies optimal the above value of 47.7 reflects the economic feasibility
conditions at a TS of 15 mm/min and Dt of 120 s, with a of these factors. This value indicates that the selected
height of 58 mm and W of 1.11 mm. The corresponding conditions optimally balance manufacturing efficiency,
efficiency value of 52.25 indicates a strong balance between part quality, and overall production costs.
the two objectives, maximizing height while minimizing The results of these analyses are visually presented in
W. This optimal condition also performs well across the Figure 6, which illustrates the performance of different
other metrics, demonstrating consistency in the evaluation welding conditions under each metric. Figure 6 presents
approach. The harmonic mean metric, which balances the wall geometry predictions of the polynomial regression
the trade-off between height and W, confirms the same models. The depicted data includes variations in TS and
optimal condition (TS = 15 mm/min, Dt = 120 s). The Dt. While this figure includes optimization metrics, its
corresponding harmonic mean value of 2.20 supports the primary focus is on displaying smooth curves or surfaces
robustness of this condition across different evaluation that represent the underlying trends, which may not
criteria. This agreement among the metrics highlights the correspond directly to the discrete experimental data
stability of the identified optimal condition. Similarly, the points detailed in the results table. The plots clearly depict
exponential score metric, which emphasizes exponential the optimal points, with markers indicating various metric
relationships in the trade-off, also confirms the optimal scores. This visual aid helps in understanding the impact
condition at a TS of 15 mm/min and Dt of 120 s, with an of each welding parameter on the overall performance.
exponential score of 10.96. This reinforces the efficiency Based on the preceding analysis, the optimization process
of the selected parameters in achieving desirable welding identified the following optimal conditions for the welding
Volume 1 Issue 3 (2024) 27 doi: 10.36922/ijamd.4285