
Page 30 - IJAMD-1-3
P. 30
International Journal of AI for
Materials and Design
Prediction of wall geometry for wire arc additive manufacturing
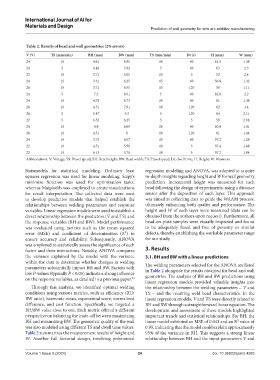
Table 2. Results of bead and wall geometries (2% errors)
V (V) TS (mm/min) BH (mm) BW (mm) TS (mm/min) Dt (s) H (mm) W (mm)
24 10 4.61 6.85 10 60 61.5 1.38
24 5 6.46 7.82 5 60 63 2.3
22 15 3.71 5.05 15 5 52 2.4
24 15 3.31 6.25 15 60 56.8 1.32
26 15 3.71 8.55 15 120 58 1.11
24 5 7.2 8.01 5 60 62.8 2.2
24 10 4,78 6.73 10 60 61 1.36
26 10 4.51 7.91 10 120 62 1.4
26 5 5.47 9.2 5 120 64 2.11
22 5 6.52 6.25 5 5 59 2.98
24 10 4.9 6.69 10 60 60.8 1.41
26 10 4.51 8 10 120 61 1.44
24 15 3.73 6.07 15 60 57.2 1.26
22 10 4.51 5.98 10 5 57.4 1.88
22 10 6.13 5.78 10 5 57.2 1.84
Abbreviations: V: Voltage; TS: Travel speed; BH: Bead height; BW: Bead width; TS: Travel speed; Dt: dwell time; H: Height; W: Waviness.
Statsmodels for statistical modeling. Ordinary least regression modeling and ANOVA, was adopted to acquire
squares regression was used for linear modeling. Scipy’s in-depth insights regarding height and W for wall geometry
minimize function was used for optimization tasks, prediction. Incremental height was measured for each
whereas Matplotlib was employed to create visualizations bead following the design of experiments, using a distance
for result interpretation. The collected data were used sensor after the deposition of each layer. This approach
to develop predictive models that helped establish the was aimed at collecting data to guide the WAAM process,
relationships between welding parameters and response ultimately enhancing both quality and performance. The
variables. Linear regression models were used to establish a height and W of each layer were measured (data can be
direct relationship between the predictors (V and TS) and obtained from the authors upon request). Furthermore, all
the response variables (BH and BW). Model performance bead-on-plate samples were visually inspected and found
was evaluated using metrics such as the mean squared to be adequately fused and free of porosity or similar
error (MSE) and coefficient of determination (R²) to defects, thereby establishing the workable parameter range
ensure accuracy and reliability. Subsequently, ANOVA for our study.
was employed to statistically assess the significance of each
factor and their interactions. Notably, ANOVA compares 3. Results
the variance explained by the model with the variance 3.1. BH and BW with a linear predictions
within the data to determine whether changes in welding The welding parameters selected for the ANOVA are listed
parameters substantially impact BH and BW. Factors with in Table 2 alongside the results obtained for bead and wall
low P-values (typically P < 0.05) indicate a strong influence geometries. The analysis of BH and BW predictions using
on the response variables, as detailed in a previous paper. 33
linear regression models provided valuable insights into
Through this analysis, we identified optimal welding the relationship between the welding parameters – V and
conditions using various metrics, such as efficiency (BH/ TS – and the resulting weld bead characteristics. In the
BW ratio), harmonic mean, exponential score, normalized linear regression models, V and TS were directly related to
difference, and cost function. Specifically, we targeted a BH and BW through a straightforward linear equation. The
BH/BW value close to one. Each metric offered a different development and assessment of these models highlighted
perspective on balancing the trade-off between maximizing important trends and statistical relationships. For BH, the
BH and minimizing BW. The geometric quality of the wall linear model exhibited an MSE of 0.043 and an R² value of
was also modeled using different TS and dwell time values. 0.95, indicating that the model could explain approximately
Table 2 summarizes the measurement results of height and 95% of the variance in BH. This suggests a strong linear
W. Another full factorial design, involving polynomial relationship between BH and the input parameters V and
Volume 1 Issue 3 (2024) 24 doi: 10.36922/ijamd.4285